Charts of Interest:
- Dow Jones in historically oversold territory
- USD/CAD working on a major breakout
- Gold is backing off despite major risk-off
Dow Jones is in historically oversold territory with only a handful of times in the last 40 years being so overdone when looking at the short-term. The Dow futures are off nearly 13% over the course of the last five sessions, a threshold not seen since the depths of the financial crisis. A bounce is due, and with growing chatter about possible emergency measures by central banks it could be a big one. We will take it one day at a time, but a bounce is seen as happening sooner rather than later.

Dow Jones Daily Chart (historically oversold)
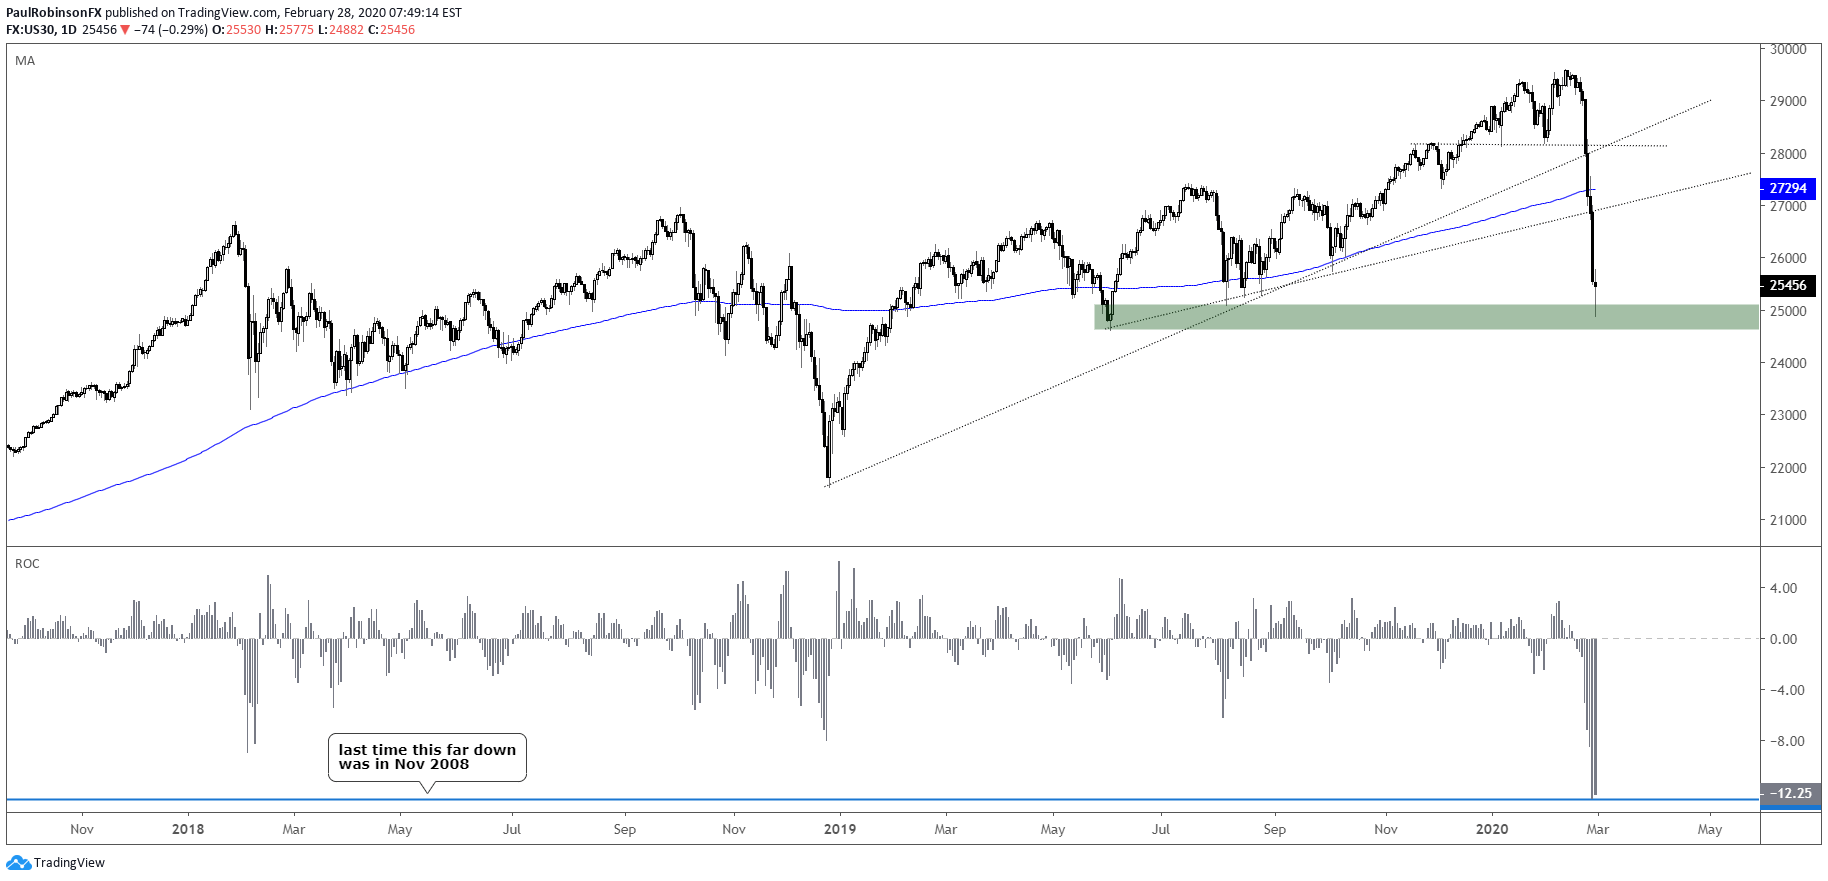
Dow Jones Chart by TradingView
USD/CAD is working on a significant breakout that could lead to some longer-term gains and a generally bullish trading bias on shorter-term charts. The pair is currently crossing over the 2016 trend-line and above some highs formed during the latter part of 2019. A weekly close (holding today’s rally) above 13382 would be ideal as confirmation.
USD/CAD Weekly Chart (working on sustaining a breakout)

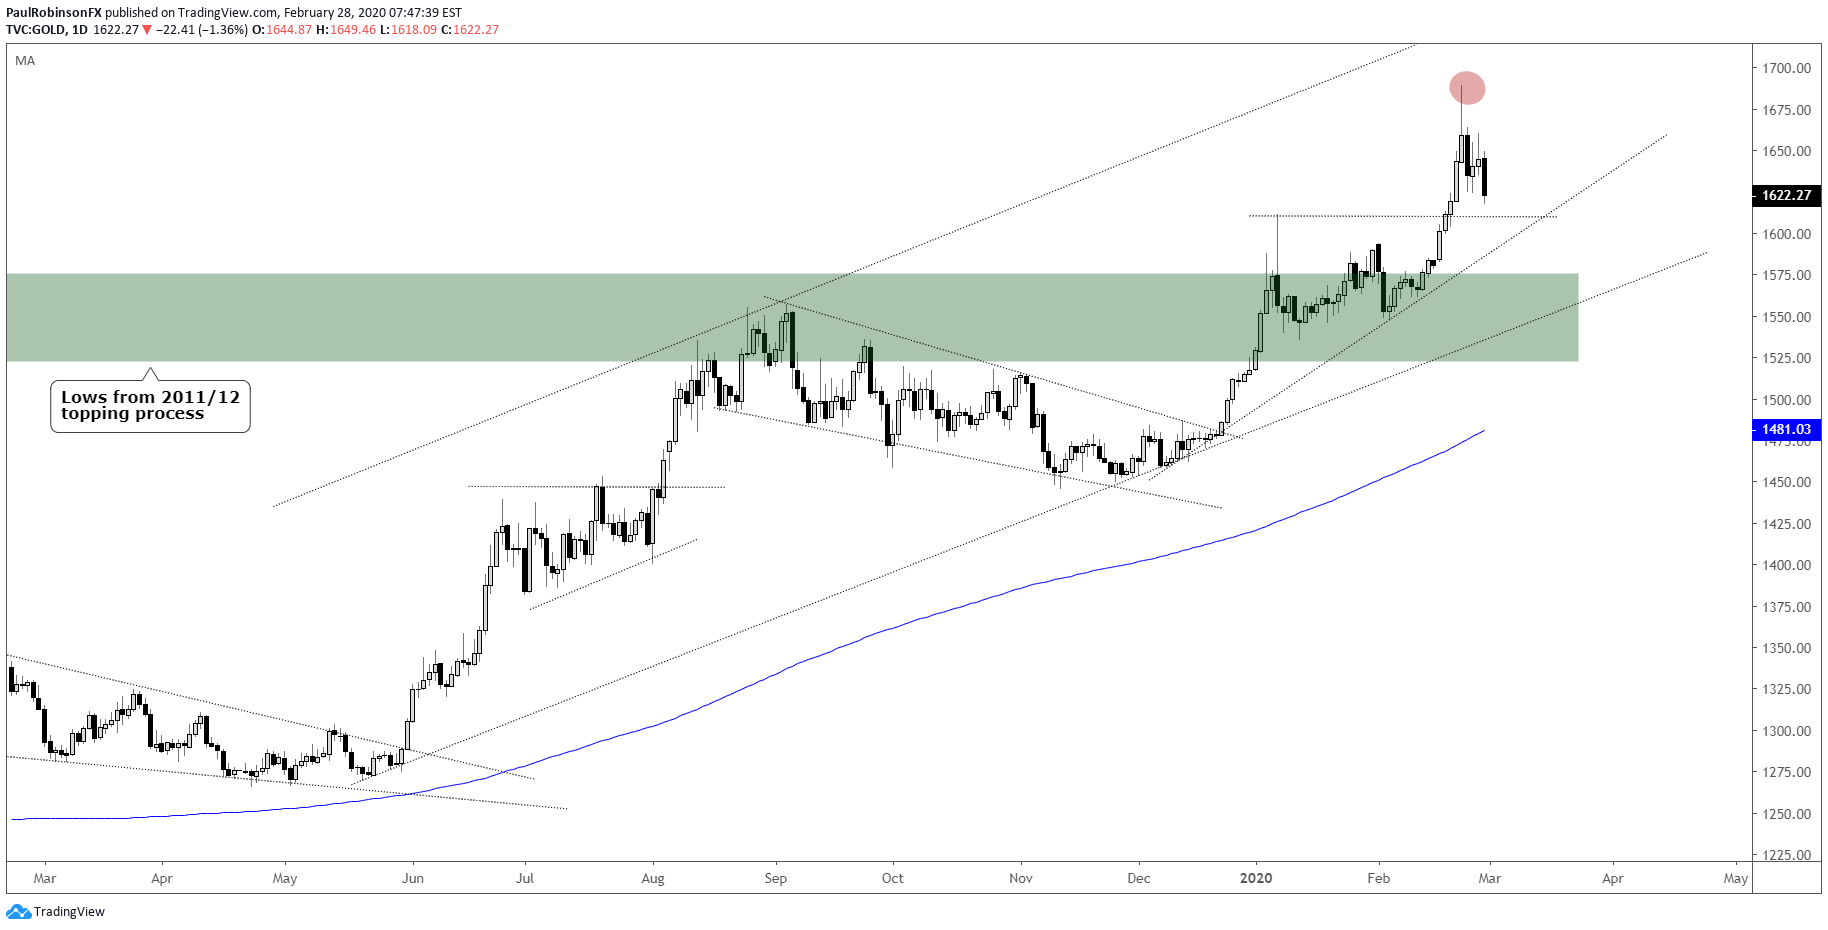
Gold is sharply underperforming expectations, catching many off guard. It looks as though a decline could deepen some more here, or a sideways move at best. Short-term this means sellers may have the upper hand, but the long-term picture is still bullish with the trend remaining firmly pointed higher. Keep an eye on the trend-line from December, and the area down in the mid-1500s, as this was the area gold struggled with from the 2011/12 topping process.
Gold Daily Chart (watch support levels)
For all the charts we looked at, check out the video above…
Resources for Index & Commodity Traders
Whether you are a new or an experienced trader, DailyFX has several resources available to help you; indicator for tracking trader sentiment, quarterly trading forecasts, analytical and educational webinars held daily, and trading guides to help you improve trading performance.
We also have a series of guides for those looking to trade specific markets, such as the S&P 500, Dow, DAX, gold, silver, crude oil, and copper.
---Written by Paul Robinson, Market Analyst
You can follow Paul on Twitter at @PaulRobinsonFX