

Dow Jones Forecast:
- Fibonacci levels on the Dow Jones are showing key spots of potential support and resistance
- MACD indicates prices are trading above the zero line
- Will fears surrounding the pandemic lead to a sell off or will earnings bring favor to bulls?
Can Bears Break Support Level held by Fibonacci
As the beginning of the week kicked off the start of earnings season, traders in the Dow Jones flocked the market with wide range of expectations. Bulls reacted with optimism as PepsiCo reported better than expected Q2 earnings and this was furthered when Pfizer increased hopes for a coronavirus vaccine. However, as the rise in cases resulted in California returning to lockdown, bears retaliated, pushing the Dow Jones back to the level of prior resistance shown by a key Fibonacci level.
The monthly chart below highlights the Fibonacci retracement (pink) taken from the August 2015 low to the February 2020 high.
The Dow Jones is currently trading around a key area of confluence on the chart. Despite a significant recovery from the March 2020 lows, the Fibonacci level continues to provide an area of resistance, keeping the bulls at bay.
Dow Jones Monthly Chart
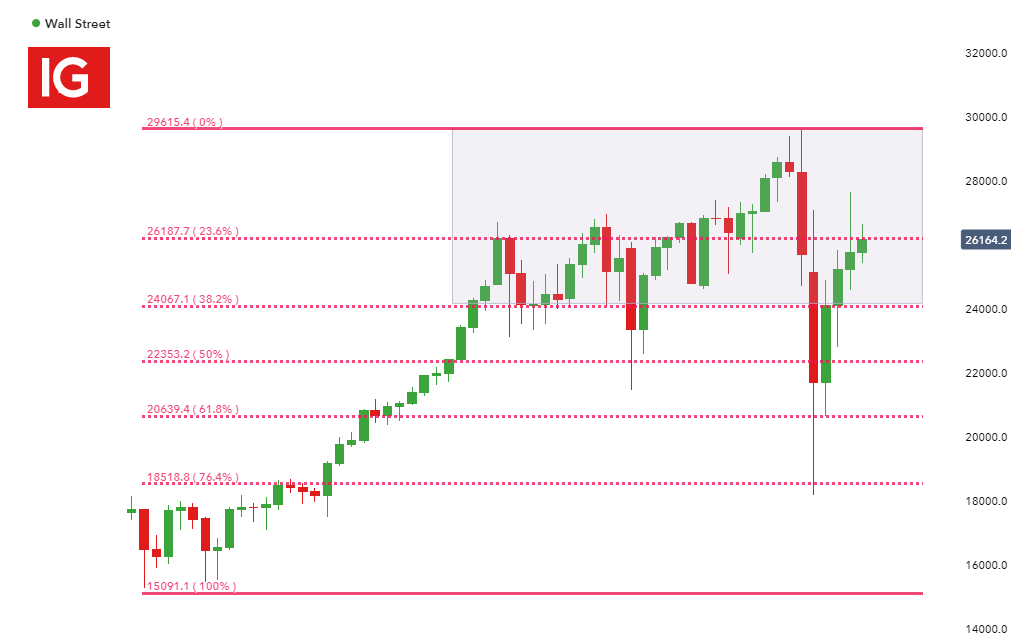
Chart created by Tammy Da Costa, IG

MACD Remains Above Zero Line
Although both bulls and the bears continue to battle it out, the hourly chart shows the moving average convergence/divergence (MACD)indicator is still trading above the zero line. While the MACD represents the difference between two exponential moving averages (in this case, the 21 and 55 EMA), the MACD can also be used to indicate overbought or oversold territory.
Dow Jones Hourly Chart
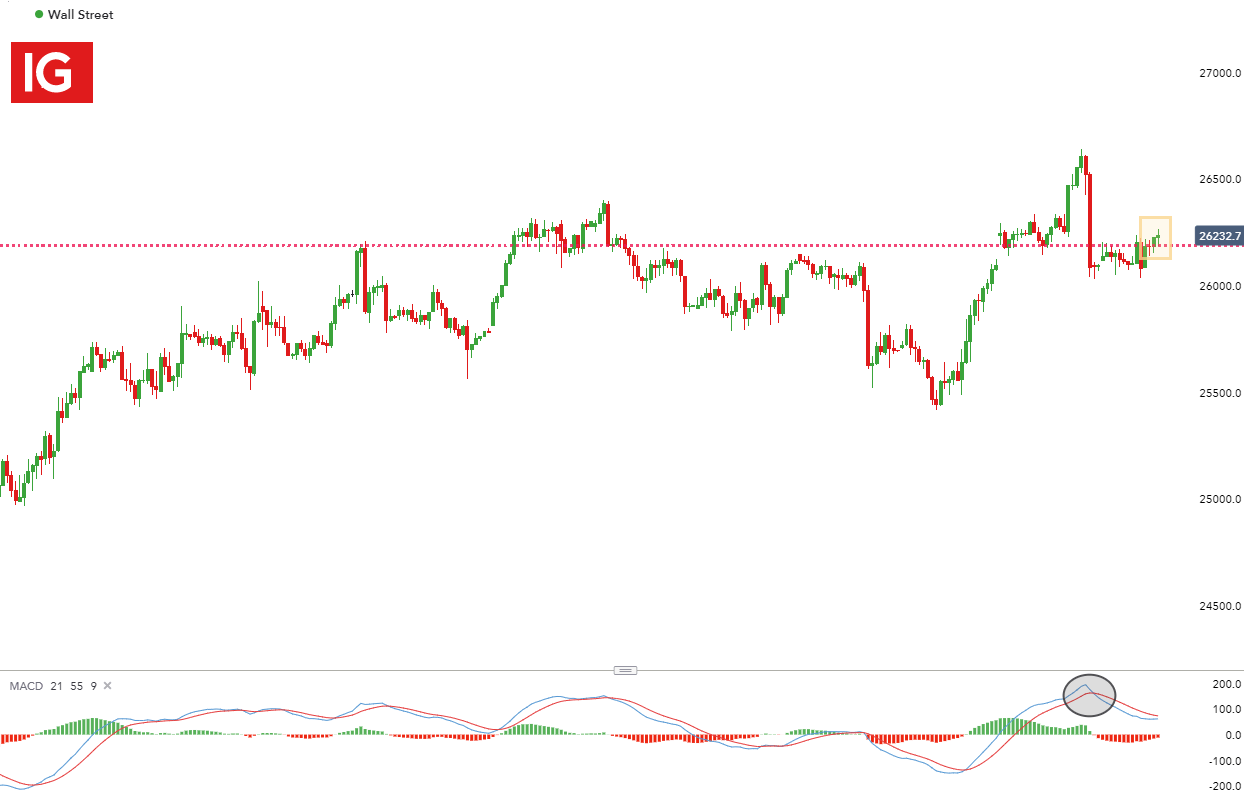
Chart prepared by Tammy Da Costa, IG
Because the MACD is commonly used to identify the momentum and direction of trend, the fact that the MACD is above the zero line may be an invitation for bulls to start looking for triggers in the same direction. On the flip side, when the MACD crosses to the downside, bears may interpret this as a signal that a deeper sell-off is expected, with the MACD crossing below the zero line as confirmation that further downside may show while keeping an eye on those key areas of support and resistance provided by Fibonacci.
Where to from here?

At the time of writing, IGCS indicates that bears are dominating the market, with 65% of retail traders holding short positions in Dow Jones. We typically take a contrarian view to crowd sentiment, and the fact traders are net-short suggests that the Dow Jones may continue to rise.