Gold Price Analysis and News
- Gold Flash Crash: How it Happened
- What Next for the Not So Precious Metal
Gold Flash Crash: What Happened
An exciting start to the week as Gold tumbles 4.5% at the Asia open, before bouncing 3.6% off the lows into the European open. The move overnight had been a continuation from the soft close at the backend of last week in response to the very strong NFP report.

As a quick recap, the NFP headline printed above expectations at 943k vs 870k expected and also much better than the dismal ADP report, which further highlights the tenuous link between ADP and NFP. (As I said on Friday, the ADP report did hold relevance in setting the bar low for an upward surprise). Alongside this, the unemployment rate fell 0.5ppts to 5.4% vs 5.7% expected, hitting a fresh cycle low. In turn, this raises the likelihood that Chair Powell may well use the Jackson Hole Symposium at the end of the month to announce a taper signal, which would be rather fitting as it would mark the anniversary of the average inflation targeting announcement.
Going back to the flash crash move overnight, it is important to remember that markets are typically at its most illiquid during the Asia session, as evidenced in recent years with the Japanese Yen in 2019 and the Pound in 2016. The thin liquidity conditions would have been further exacerbated by the fact that Japanese markets had been closed due to a public holiday. Keep in mind, that this was the first opportunity for leveraged Asian based traders to react to Friday’s NFP report, therefore I would not read too much into the move as a response to new information and instead more a continuation of Friday’s reaction. On the chart, the break of 1760, which has been a pivotal level in recent months looks to have triggered stops below prompting large sell orders to take gold to the YTD double bottom.
Gold Price Chart: 10 Minute Timeframe
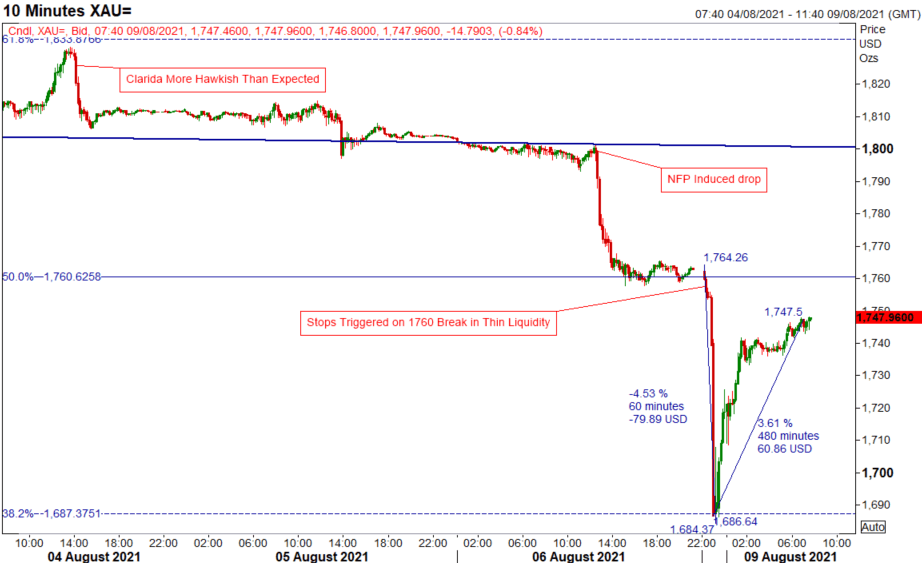
Source: Refinitiv
What Next For Gold?
Given that Gold has bounced $65 off the lows, the aforementioned $1760 level will be the key area to watch where failure to break above keeps the immediate pressure on the downside in the (not so) precious metal. Above 1760, resistance resides 1790-1800.
Elsewhere, while Fed speakers will garner attention, the main highlight on the economic calendar will be the US CPI report, where a sizeable headline beat could prompt another push lower in gold. Now I realise what I’m saying goes against the popular belief that gold is an inflation hedge, however, if inflation were to notably beat expectations, this would likely increase bets of tighter monetary policy, leading to higher USD and yields, which in turn would weigh on Gold.
Gold Price Chart: Daily Time Frame

Source: Refinitiv
| Change in | Longs | Shorts | OI |
| Daily | -2% | -5% | -3% |
| Weekly | -4% | 10% | 1% |