

Gold (XAU/USD) Price, Chart, and Analysis
- Gold has reclaimed all of the Asia flash crash.
- A notable area of resistance nears.
- Big increase in weekly retail traders net-short positions.

The gold flash crash seen in Asia at the start of the week has now been fully retraced, leaving the precious metal just below a prior support level that now acts as resistance. Gold has been under pressure from a stronger US dollar, and higher US Treasury yields, as market thoughts now turn to the timing of taper talks, as the US looks to reduce its bond-buying program. There are growing expectations, fueled by some hawkish Fed talk of late, that Fed chair Jerome Powell may use the Jackson Hole Symposium – ‘Macroeconomic Policy in an Uneven Economy’ (August 26-28) as a springboard to suggest that the US QE program may soon begin to be wound down, with an official timetable announced by the Fed in November. These expectations have pushed the US dollar higher, weighing on the price of gold.
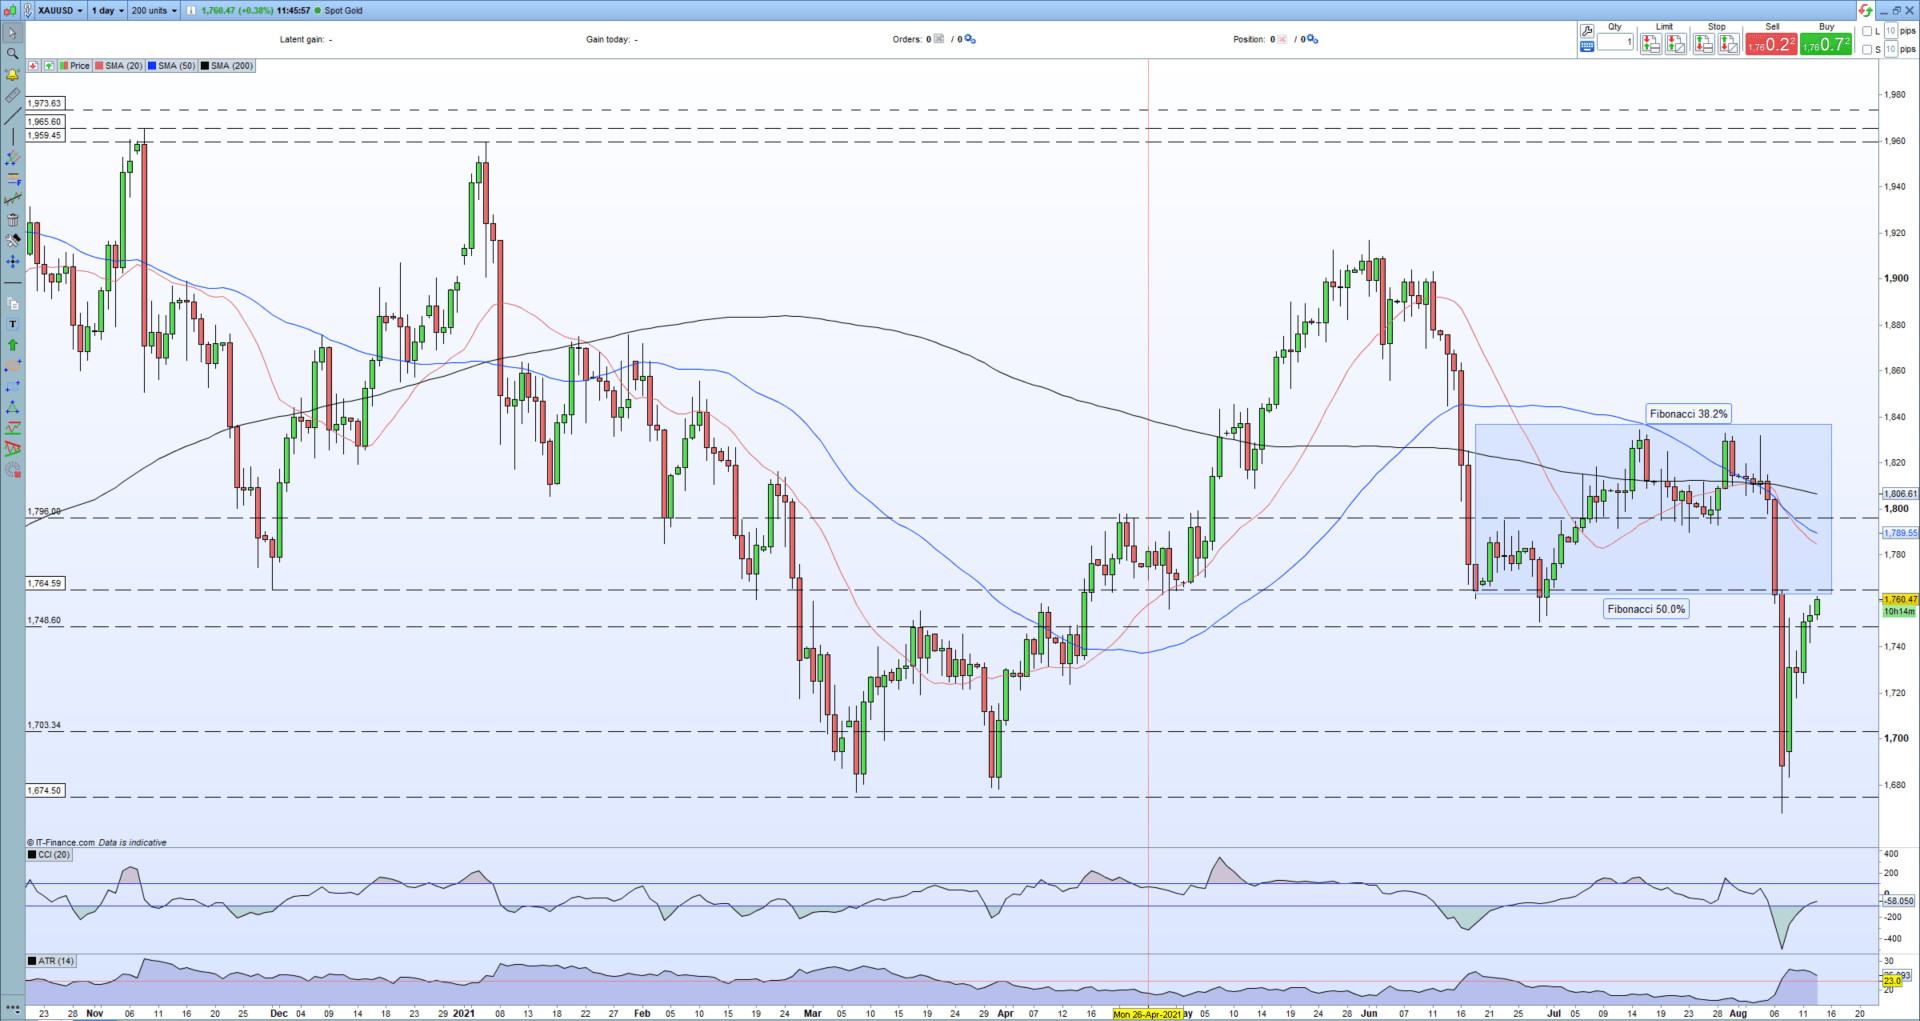
The spot gold price is now nearing $1,764/oz. the 50% Fibonacci retracement level of the mid-March/early-August 2020 rally that peaked at $2,075/oz. Price action around this level in mid-April this year acted as a base for the move to $1,916/oz. while it also acted as support around mid-June. Gold is now pushing into this area of resistance. The precious metal is no longer oversold, according to the CCI indicator, while the three simple moving averages remain in a bearish formation after posting a negative 50-day/200-day ‘death cross’ early last week. Ahead of the weekend, gold may run into a bout of volatility, especially with the closely watched University of Michigan consumer sentiment and inflation expectations readings released later this afternoon.
Keep up to date with all market-moving data releases and events by using the DailyFX Calendar
Gold (XAU/USD) Daily Price Chart (November 2020 – August 12, 2021)
Retail trader data show 71.79% of traders are net-long with the ratio of traders long to short at 2.55 to 1. The number of traders net-long is 1.36% lower than yesterday and 8.25% lower from last week, while the number of traders net-short is 0.80% higher than yesterday and 76.90% higher from last week.
We typically take a contrarian view to crowd sentiment, and the fact traders are net-long suggests Gold prices may continue to fall.Yet traders are less net-long than yesterday and compared with last week. Recent changes in sentiment warn that the current Gold price trend may soon reverse higher despite the fact traders remain net-long.

What is your view on Gold – bullish or bearish?? You can let us know via the form at the end of this piece or you can contact the author via Twitter @nickcawley1.