
Dow Jones, ASX 200, Australia GDP, Technical Analysis – Asia Pacific Indices Briefing
- Dow Jones weakened to wrap up solid month for stocks on Wall Street
- Higher Euro-area CPI, soft US consumer confidence dented sentiment
- ASX 200 may look past Australian GDP data as focus remains on Covid
Trade Smarter - Sign up for the DailyFX Newsletter
Receive timely and compelling market commentary from the DailyFX team
Tuesday’s Wall Street Trading Session Recap
On Wall Street, the Dow Jones Industrial Average, S&P 500 and Nasdaq Composite closed -0.11%, -0.13% and -0.04% respectively. This quiet day wrapped up a rosy month for the indices, which gained 1.22%, 2.90% and 4.00% respectively. The outperformance of tech shares compared to cyclical stocks was likely fueled by the Fed’s reiteration last week that despite policy tapering being just around the corner, rate hikes are not.
The cautiously jittery mood in financial markets may have been due to a combination of higher-than-expected Euro-area inflation and disappointing US Conference Board Consumer Confidence data. German 10-year government bond yields closed at the highest since July 19th, likely reflecting rising bets about the European Central Bank eventually joining the Fed to reduce quantitative easing down the road.
Traders may have also been positioning themselves ahead of September, which historically tends to be a disappointing month for the S&P 500. This is often attributed to seasonal behavior as investors return from the summer holiday to book profits. Still, the post-Covid world has been full of surprises. This includes the surge in retail trading, perhaps threatening to upend this seasonal dynamic.

Dow Jones Technical Analysis
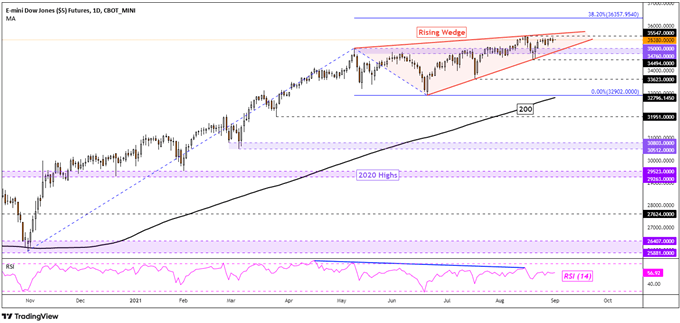
On the daily chart below, Dow Jones futures appear to be consolidating higher within the boundaries of a bearish Rising Wedge chart pattern. Negative RSI divergence continues to persist, showing that upside momentum is fading. That can at times precede a turn lower. Otherwise, clearing immediate resistance at 35547 exposes the 38.2% Fibonacci extension at 36357.
Dow Jones Futures – Daily Chart
Wednesday’s Asia Pacific Trading Session
With that in mind, Asia-Pacific markets may follow the cautious lead set by Wall Street for Wednesday’s session. A top-tier event risk will be Australian second-quarter GDP data for the ASX 200. The reading accounts for economic output produced from April through June 2021, which is prior to the nation’s most recent Covid outbreak amid the more contagious Delta strain.
This means that it does not include the economically-damaging effects of the lockdowns that the country undertook in recent weeks. Australian preliminary services PMI data for August showed a material contraction in economic activity. As such, investors may brush aside the GDP reading all together and place more focus on the Q3 report due later this year as well as more timely data.

ASX 200 Technical Analysis
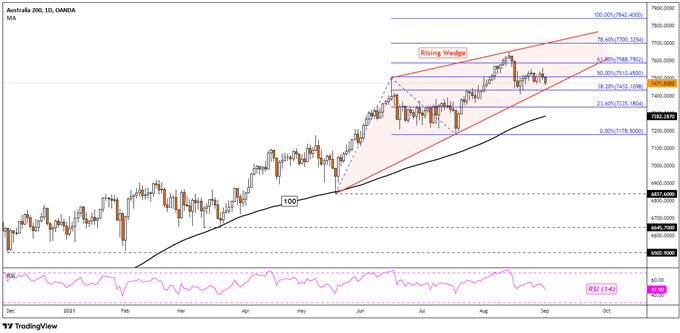
The ASX 200 continues to trade under the all-time high set on August 13th, with the index consolidating higher within a bearish Rising Wedge chart pattern. Prices are sitting just on the floor of the wedge, where a breakout to the downside could open the door to a material turn lower. Such an outcome may expose the 100-day Simple Moving Average (SMA) which may reinstate the dominant focus to the upside.
ASX 200 Futures – Daily Chart
--- Written by Daniel Dubrovsky, Strategist for DailyFX.com
To contact Daniel, use the comments section below or @ddubrovskyFX on Twitter