
HSI Analysis
- China’s strategic lending rates trimmed once again.
- Hang Seng Index revival.
HANG SENG FUNDAMENTAL BACKDROP
Earlier today, the Chinese central bank announced rate cuts on both the 1 and 5-year LPR by 10bps and 5bps respectively. This comes in response to economic challenges facing the country by lowering borrowing costs and stimulating growth. Omicron outbreaks have further dampened economic activity as China employs a zero tolerance approach to COVID-19. The property sector has been the bane of the Chinese financial system of recent, stemming from the Evergrande debacle but the current easing rotation may assist in converting the embattled Chinese property market.
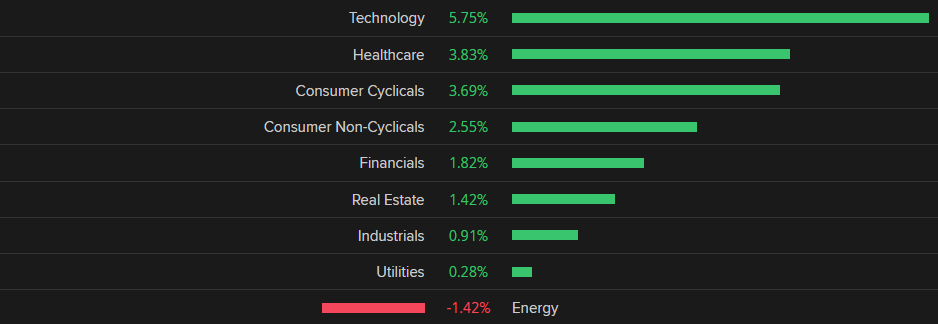
Tech stocks rallied after the announcement while the only sector in the red today is energy as a result of falling crude prices (see graphic below). The likelihood of further cuts over the next few months is highly probable, leaving an extremely supportive environment for Chinese stocks short-term.
HSI SECTOR SUMMARY

TECHNICAL ANALYSIS
HANG SENG INDEX DAILY CHART
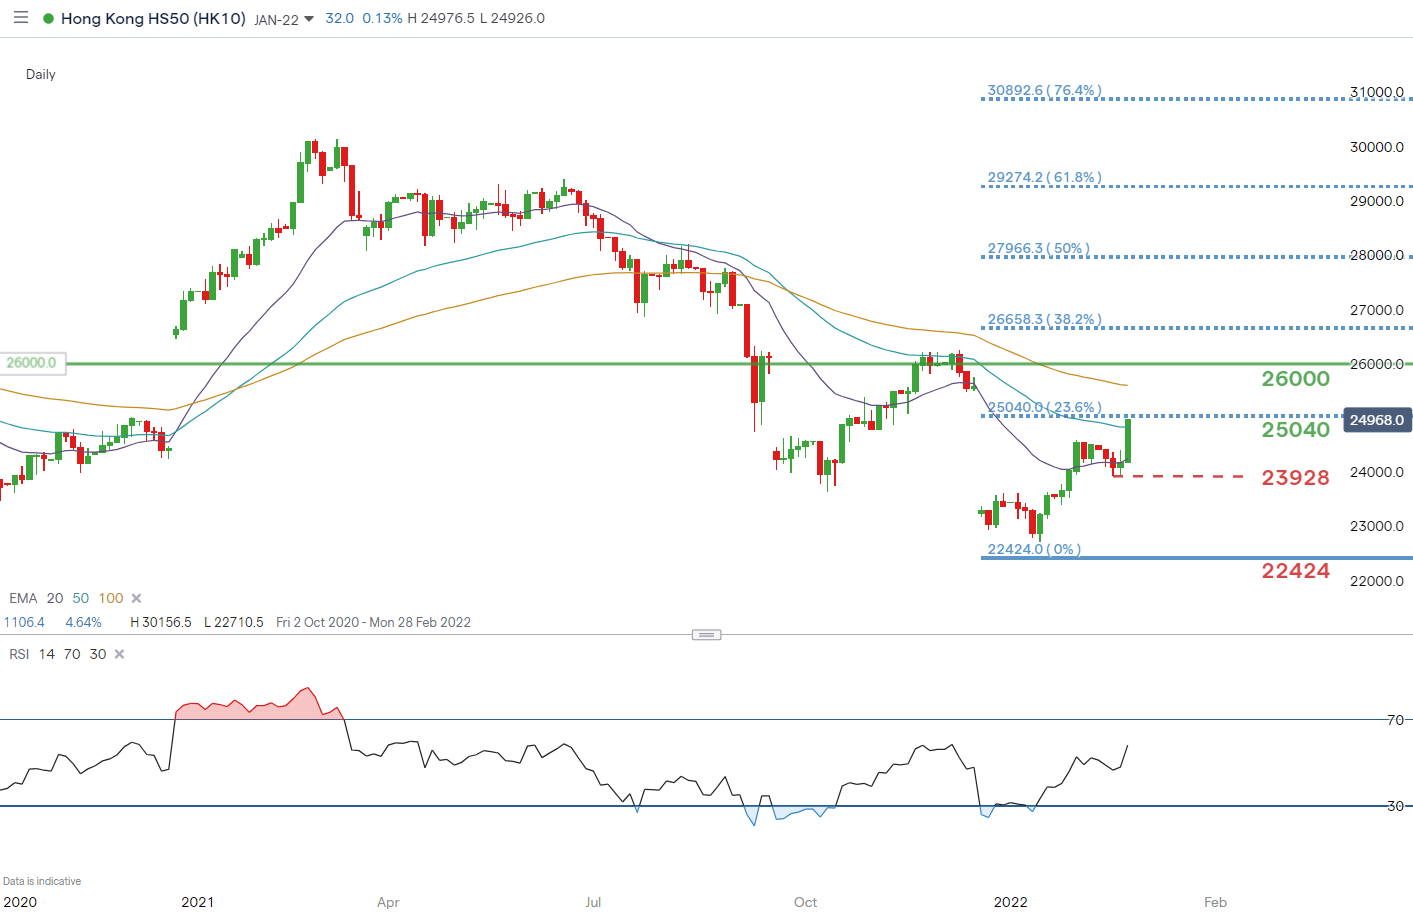
Chart prepared by Warren Venketas, IG
Price action on the daily HSI chart shows bulls approaching the 23.6% Fibonacci at 25040 (taken from January 2018 high – March 2020 low). A break above this key area of confluence will in turn open up subsequent resistance targets and with the accommodating fundamental conditions, its hard to see why this won’t happen.
Resistance levels:
- 26000
- 100-day EMA (yellow)
- 25040
Support levels:
- 23928
- 22424
Contact and follow Warren on Twitter: @WVenketas