
BRENT CRUDE OIL (LCOc1) ANALYSIS
- Possibility of Iran growing global supply weighs on brent.
- Lingering threat in Russia provides floor for crude prices.

CRUDE OIL FUNDAMENTAL BACKDROP
Brent crude opened slightly weaker this morning on the back of Iran re-entering the global supply market, outshining fears around Russian/Ukraine tensions which have driven brent above $95/barrel.
With stockpiles across the globe currently at record lows and demand set to increase as services sectors pick up (airlines etc.), crude oil prices are likely to remain elevated. COVID-19 worries have since taken a back seat giving added upside impetus, while China looks to stimulate its economy – always a positive for oil demand.
Learn more about Crude Oil Trading Strategies and Tips in our newly revamped Commodities Module!
ECONOMIC CALENDAR
Barring geopolitics which is likely to ebb and flow over the course of the day and upcoming weekend, dollar releases are limited to Fed speeches later today. Yesterday, the Fed’s Mester and Bullard sided with a more hawkish rhetoric which has not translated into dollar strength. I do believe the dollar move is likely to fade as bearish momentum slows and the prospect of front-end loading of rates looms, leading to downward pressure on crude.
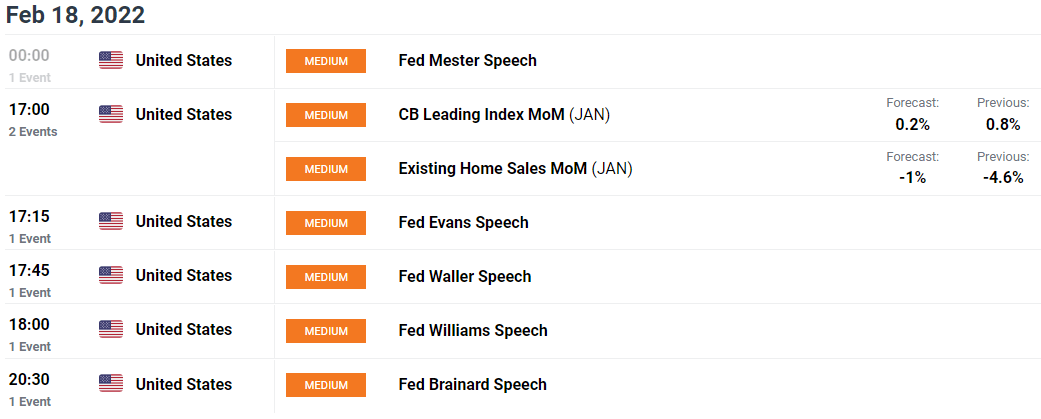
Source: DailyFX Economic Calendar

TECHNICAL ANALYSIS
BRENT CRUDE (LCOc1) DAILY CHART
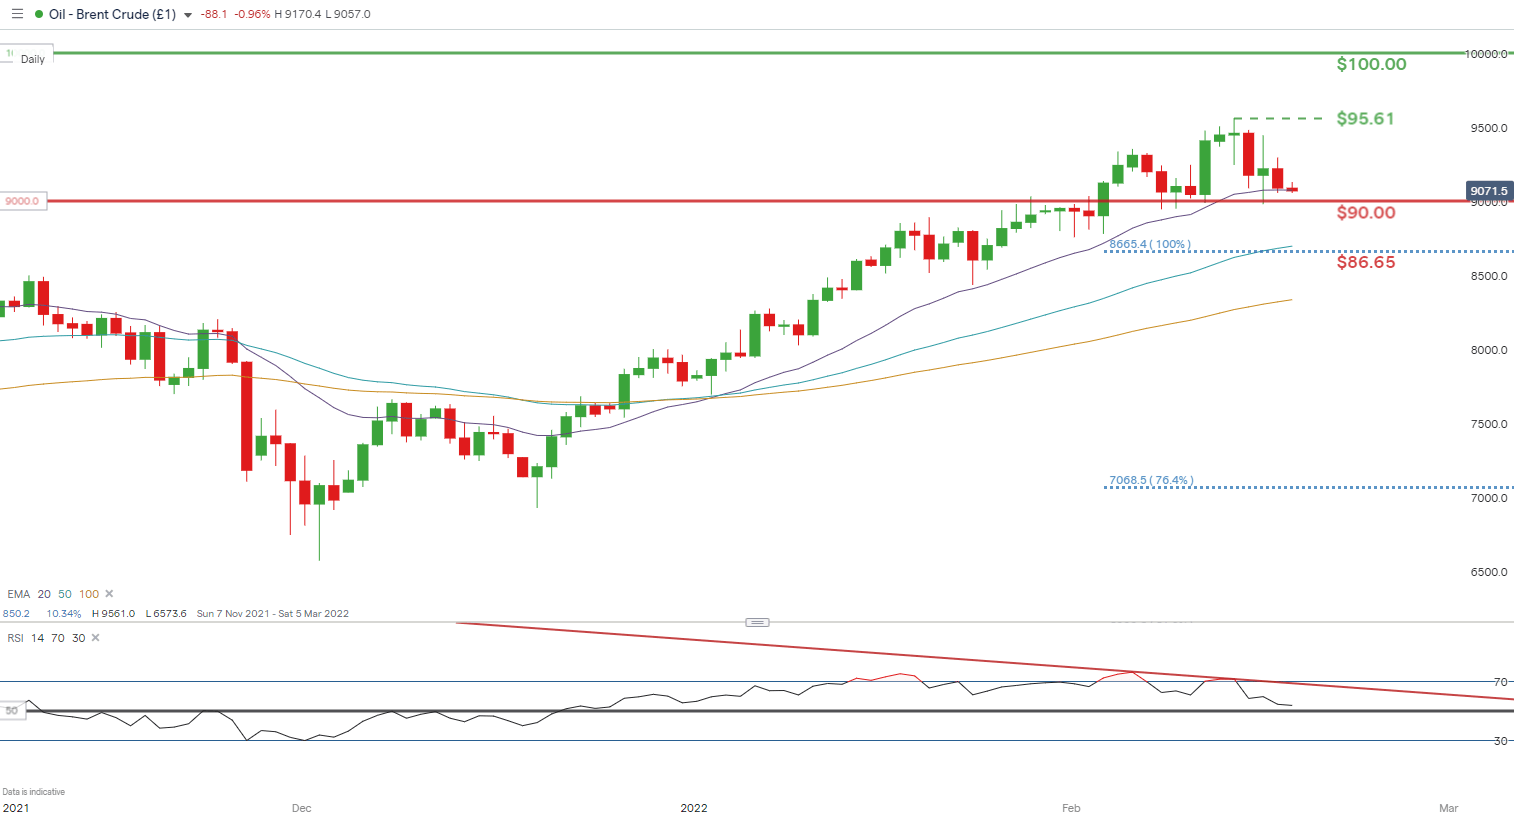
Chart prepared by Warren Venketas, IG
The daily brent chart shows the progression on bearish divergence whereby the Relative Strength Index (RSI) reflects lower lows (red) while price action for the same period shows higher highs. This is generally a bearish signal which has since been developing. With so many variables at play across all financial markets, it is difficult to forecast any directional bias at this point until we have more clarity around the geopolitical situation. I do think the range lies between $90 - $100 medium-term (ceteris paribus) but should Iran re-enter we could see a slight drop towards $86.65 before climbing higher on demand forecasts.
Key resistance levels:
- $100.00
- $95.61
Key support levels:
- 20-day EMA (purple)
- $90.00
- $86.65
IG CLIENT SENTIMENT BEARISH
IGCS shows retail traders are marginally NET SHORT on Crude Oil, with 53% of traders currently holding short positions (as of this writing). At DailyFX we typically take a contrarian view to crowd sentiment however, the change in recent shorts and longs result in a short-term downside bias.

Contact and follow Warren on Twitter: @WVenketas