

Crude Oil, WTI, White House, Strategic Reserves, Inflation - Talking Points:
- Crude oil prices sink as White House weighs releasing more strategic reserves
- This plan outlines one million barrels of oil per day to help alleviate inflation
- WTI continues to trade within a Symmetrical Triangle, watch for a breakout

WTI crude oil prices sank as much as 5 percent during early Thursday Asia-Pacific trade after reports crossed the wires that the White House is weighing another plan to help alleviate rising prices at the pump. According to Bloomberg, the Biden administration is looking into releasing one million barrels of oil daily from strategic reserves for several months.
This follows strong gains in the commodity since November, which picked up pace as Russia attacked Ukraine. During this period, the price of WTI climbed from a low of USD 62.46 to a high of 129.42 in early March. Since then, fading European geopolitical escalation concerns have seen the commodity fall about 20% from the latest high.
Still, this has not been enough to bring down prices at United States gas stations materially. According to data from the US Energy Information Administration (EIA), the average price of regular gasoline, which is in dollars per gallon, clocked in at 4.23 for the week ending March 28th. This is up from 3.53 before the Russian attack, which represents a 19.8% increase.
Prices have fallen from the week ending March 14th, which was 4.32, but this only represents a 2% decrease. According to the report, the total amount could come up to 180 million barrels. For comparison, the Biden administration has released about 80m over the past 6 months from similar efforts. All eyes now turn to a potential announcement over the coming 24 hours.
WTI Market Reaction – 5min Chart
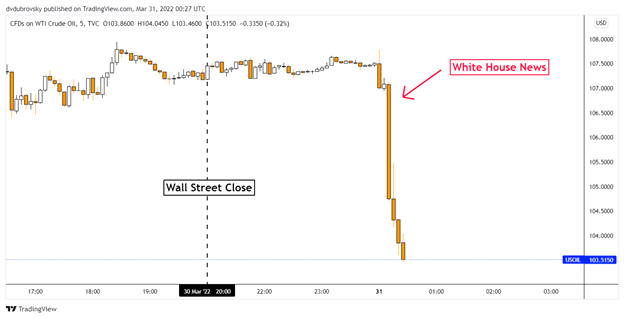
Chart Created Using TradingView
Technical Analysis
On the 4-hour chart, WTI appears to be trading within a Symmetrical Triangle chart formation. The direction of the breakout could be pivotal, hinting at the trend to come. The floor of the triangle seems to be rising support from the middle of March. Falling resistance from the beginning of this month offers to be the ceiling. Clearing lower exposes the 93.51 – 95.22 support zone. On the other hand, breaking higher may open the door to revisiting the March 23rd swing high at 116.61.
Trade Smarter - Sign up for the DailyFX Newsletter
Receive timely and compelling market commentary from the DailyFX team
WTI 4-Hour Chart
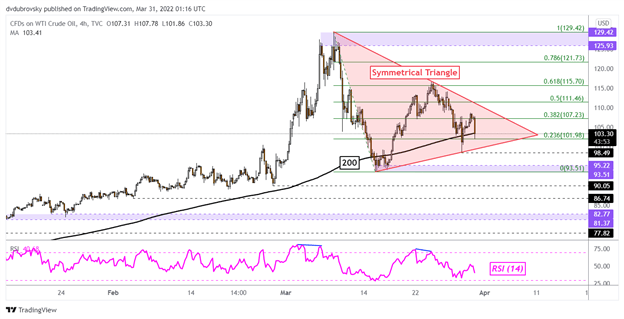
Chart Created Using TradingView
--- Written by Daniel Dubrovsky, Strategist for DailyFX.com
To contact Daniel, use the comments section below or @ddubrovskyFX on Twitter