EUR/JPY, GBP/JPY, CHF/JPY - Talking Points
- The JPY weakening against EUR, GBP and CHF has stalled of late
- Sideways trading has set up some break-out points to watch
- Have the Europe-Yen crosses peaked for now or will the trend resume?
Introduction to Technical Analysis
Learn Technical Analysis
Recommended by Daniel McCarthy
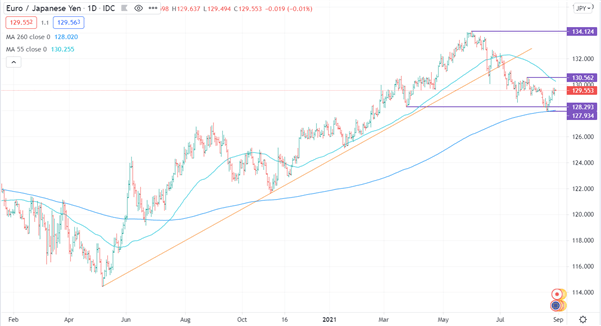
EUR/JPY Technical Analysis
Since the low seen in May 2020, EUR/JPY consistently found support on its way to a high of 134.55 in June this year. Shortly after that, the cross broke below the up-trend line and has moved down. A key support level at 128.29 was broken but prices failed to follow through. This established a new low/support level at 127.93 which, at the time, was the 260-day simple moving average (SMA). The 260-day SMA is now a support at 128.02.
On the topside, there is resistance at the most recent high of 130.56 and then the previous high of 134.55. The 55-day SMA resistance currently comes in at 130.25.
While some up-trend support levels have been breached, these are not convincing breaks and a sustained move below 127.90 is needed to confirm them. Looking upward, it looks like there’s a lot of wood to chop to make a new high and resume the up-trend.
Trade Smarter - Sign up for the DailyFX Newsletter
Receive timely and compelling market commentary from the DailyFX team
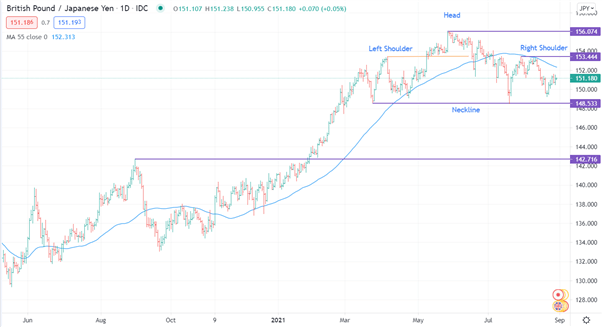
GBP/JPY Technical Analysis
The shape of the GBP/JPY chart is similar to EUR/JPY, but there are some key differences. Most notably, the low seen in July did not breach the previous one seen in March, allowing for a Head and Shoulders technical set-up. This keeps the neckline at 148.53 intact and a key support. Taking the distance of the head (156.07) to the neckline (148.53), a break below 148.50 may open a move of similar magnitude toward 141.00. With that in mind, past performance is not indicative of future results. Additionally, there is a long-term support level at 142.71
On the topside, resistance comes in at the 55-day SMA of 152.31 and then the previous high at 153.44. Beyond that, the overall high of the year at 156.07 is the next significant resistance level.
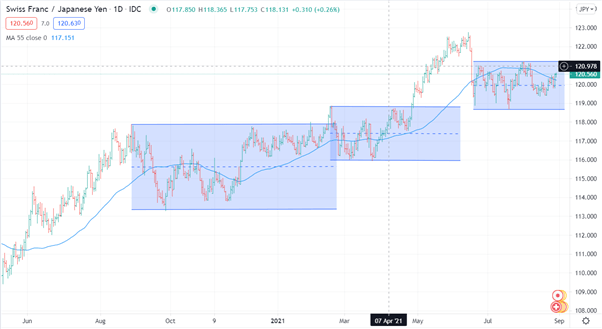
CHF/JPY Technical Analysis
Looking at the CHF/JPY chart, a stand-out characteristic of the cross is that it has a tendency to trade sideways on a regular basis. This range trading trait is not surprising given the similarities in the underlying currencies. The current levels to watch for a break-out are 118.65 to the downside and 121.21 on the topside.
--- Written by Daniel McCarthy, Strategist for DailyFX.com
To contact Daniel, use the comments section below or @DanMcCathyFX on Twitter