Dow, S&P 500, FTSE, DAX, Nikkei Technical Talking Points:
- S&P 500 Breaks Trend Support, Softens Technical Outlook.
- US Dollar Drops as NFP Prints +134k; EUR/USD Re-Tests Resistance.
- Are you looking for longer-term analysis of Equity prices? Check out our Quarterly Forecasts as part of the DailyFX Trading Guides.
Stocks Pull Back in First Week of Q4
Q4 is seeing an increasing amount of pressure around equities as an initial move higher to kick-off the quarter has been soundly faded-out. While the Dow set a fresh all-time-high in the first few days of the quarter, the S&P 500 put in a similar move of strength. The Nikkei punched-up to a fresh 27-year high on Monday, but the second-half of the week hasn’t been so kind to those prior bullish themes. Meanwhile in Europe, risk aversion has reared its ugly head and both the DAX and the FTSE 100 are undergoing bearish themes; bringing to question the viability of a continuation of the strength that showed in the second-half of September in both indices.
Given the context, it could be helpful to take a step back to get a bigger-picture look at matters.
Q3 was remarkably strong for US stocks, as the S&P 500 moved up by as much as 9.4% from the late-June swing-lows up to the September high. This helped to create a series of fresh all-time-highs in the process, and this move happened despite backdrop of risk aversion that showed up this summer around both Italy and Turkey. The Dow Jones had an even better Q3, as we saw prices move up by as much as 12.4%, and the Nikkei put in a historical move by finally breaking out from the 50% marker of the indexes 28-year major move. So there are a lot of positives to take away from last quarter around equities in the US and Japan.
Europe, on the other hand, has a bumpier road ahead, and we’ll look into this scenario below as we take a trip around the world of global equities.
S&P 500 Breaks Q3 Bullish Trend-Line
After spending three months riding a bullish trend-line up to fresh all-time-highs, the S&P 500 has finally broken the chain and we’re now seeing some bearish push develop. The area that we had followed for higher-low support plays in the last week of September had held up well as higher-low support up until Wednesday of this week. But as the pullback has deepened, prices have dropped down to a deeper level of support that we’d previously used earlier in September to position-in to bullish plays, and this zone runs around 2880.
The key takeaway here is that the S&P is working on lower-lows and lower-highs, and this may not be the time to push the bullish stance in the index. This doesn’t yet obviate the bullish trend in the S&P 500, but timing that approach will be key – and traders will likely want to wait for some confirmed element of support before looking to take on risk with bullish continuation strategies. Deeper support potential exists around 2860, 2845 and then again at 2824. If we take out 2824, something in the backdrop has shifted, and the bullish stance should come into question as something new will likely be getting priced-in at that point.
Technical Forecast for the S&P 500: Neutral
S&P 500 Four-Hour Price Chart: Q3 Bullish Trend-Line Broken in the First Week of Q4
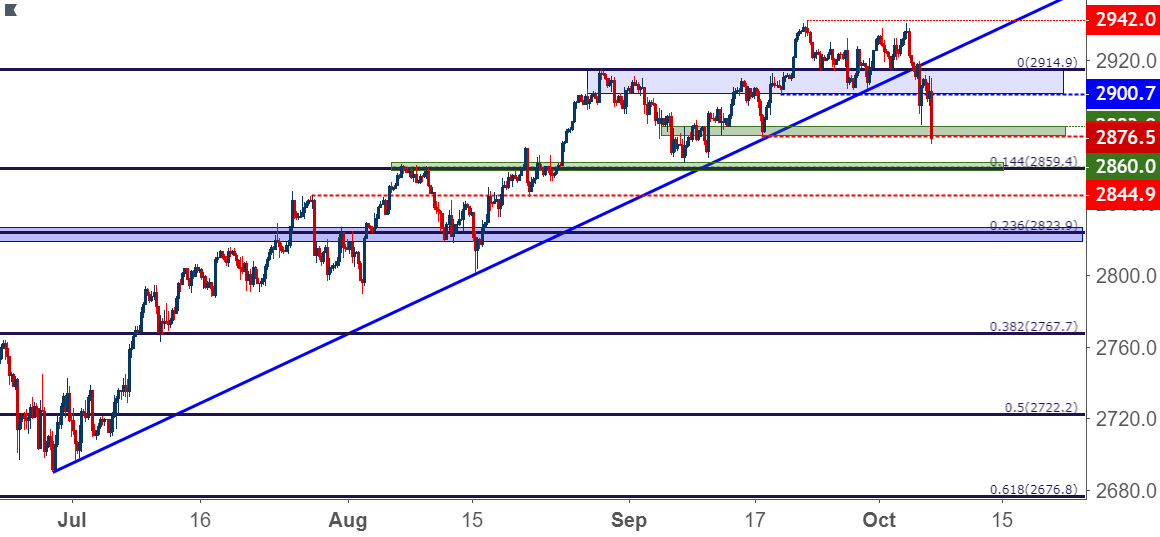
Chart prepared by James Stanley
Dow Jones Pulls Back
We saw a similar bullish theme develop in the Dow during Q3, but the run here was a bit stronger than what was seen in the S&P 500 as the Dow made a 12.4% jump from the June swing lows up to the October swing highs. A remarkable run by any stretch of the imagination, particularly considering the late stage of the recovery that we’re currently in.
Mirroring the S&P, that chain of strength faced a bit of pressure this week as prices pulled back on Thursday and Friday to eliminate all of the prior October gains and then some.
We’re in a similar spot with the Dow: The longer-term trend has been long and strong, but short-term momentum is running counter to that theme in a rather aggressive manner. It appears prudent at this point to let the short-term sell-off run its course, or to wait for this pullback to become something larger by taking out bigger-picture support levels before shifting to a bearish stance.
Such support potential exists around 26217-26260 and a bit lower from 25931-26000. If we break below 25931, we would need to start asking whether something in the backdrop has shifted that should elicit a removal of the bullish stance.
Technical Forecast for the Dow: Neutral
Dow Jones Four-Hour Price Chart: Deeper Support Potential Exists
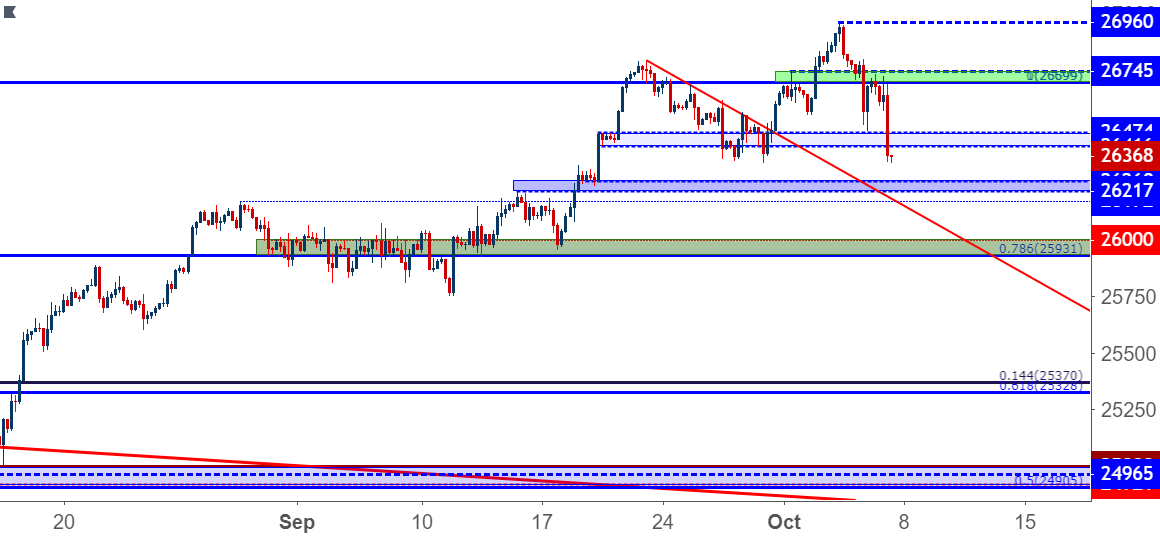
Chart prepared by James Stanley
DAX: Confluent Resistance Takes its Toll
Coming into September, we looked at a bearish setup in the DAX as prices had found resistance at a confluent area on the charts. That bearish run lasted for the first ten days of the month, but the next ten days were marked by a pullback to that very same level. That resistance held through the remainder of September and into October before sellers re-grasped control, and so far this week we’ve seen a continuation of that weakness with prices moving back-down towards 12k.
This confluent resistance comes from the underside of the 2016-2018 bullish trend-line along with the 23.6% Fibonacci retracement of that same major move. This opens the door for a re-test of the March lows at the 38.2% retracement of that same move, and the forecast for next week will be set to bearish.
Technical Forecast for the DAX: Bearish
DAX Weekly Price Chart: X Marks the Spot, Prices Drop from Confluent Resistance

Chart prepared by James Stanley
FTSE 100: It Was a Nasty Week that Bulls Soon Hope to Forget
The FTSE had a similarly positive second half of September after a very different open to the month. Even Q4 opened in a somewhat positive manner as prices held the line Monday-Wednesday.
Thursday, however, brought a far different tone and that lasted into the close of the week. The selling was so pronounced that traders may want to take a step back from both sides of the trade at this point, as we’re looking at short-term oversold conditions while also nearing an area of support that gave us a solid week-and-a-half of grind in mid-September. A bearish breakdown below that support area that runs from 7220-7254 could re-open the door to bearish strategies but, until then, traders should remain cautious as we’ve seen volatility pick up here to a very respectable degree.
FTSE Technical Forecast: Neutral
FTSE Daily Price Chart: A Tough Two-Day Stretch
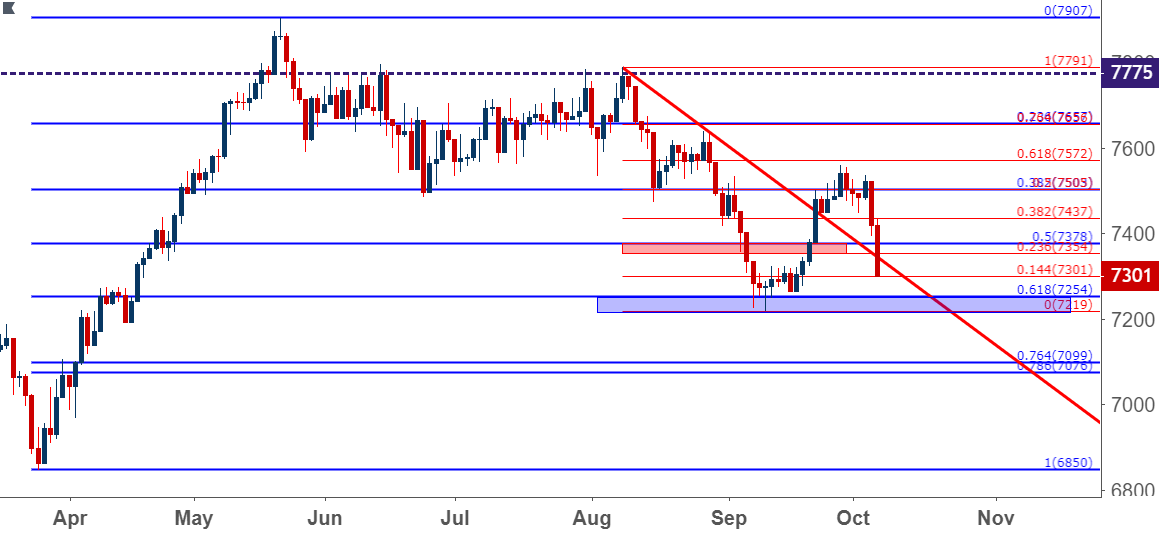
Chart prepared by James Stanley
Nikkei Bullish Breakout Finally Pulls Back
It was a really strong month of September in the Nikkei. Coming into the month, we looked at an ascending triangle pattern that had started to build, anticipating a bullish breakout as a long-term resistance level continued to face tests. Each time prices pulled back from resistance, the effect was growing weaker, leading to the upward-sloping trend-line that made up the bottom of the formation.
That breakout caught in the middle of the month, and continued to run into the Q4 open. We’ve seen seen prices pull back, and the big question is whether we get a dose of higher-low support before retesting that area of prior resistance. This opens the door to two different potential support zones – one taken from the November, 2017 swing high around 23423, and another around that prior point of resistance around 22946.
Technical Forecast for the Nikkei: Bullish
Nikkei Daily Price Chart

Chart prepared by James Stanley
To read more:
Are you looking for longer-term analysis on the U.S. Dollar? Our DailyFX Forecasts for Q1 have a section for each major currency, and we also offer a plethora of resources on USD-pairs such as EUR/USD, GBP/USD, USD/JPY, AUD/USD. Traders can also stay up with near-term positioning via our IG Client Sentiment Indicator.
Forex Trading Resources
DailyFX offers a plethora of tools, indicators and resources to help traders. For those looking for trading ideas, our IG Client Sentiment shows the positioning of retail traders with actual live trades and positions. Our trading guides bring our DailyFX Quarterly Forecasts and our Top Trading Opportunities; and our real-time news feed has intra-day interactions from the DailyFX team. And if you’re looking for real-time analysis, our DailyFX Webinars offer numerous sessions each week in which you can see how and why we’re looking at what we’re looking at.
If you’re looking for educational information, our New to FX guide is there to help new(er) traders while our Traits of Successful Traders research is built to help sharpen the skill set by focusing on risk and trade management.
--- Written by James Stanley, Strategist for DailyFX.com
Contact and follow James on Twitter: @JStanleyFX
Other Weekly Technical Forecast:
Australian Dollar Forecast: AUD/USD and GBP/AUD Achieve Critical Breakouts, Eyeing New Levels