Equities Talking Points:
- S&P 500 and Nasdaq 100 Charts – Amazon, Google Earnings Weigh Today.
- Dow Jones Re-Tests 25k; Wall of Worry Proving Too Tall to Climb.
- Are you looking for longer-term analysis of Equity prices? Check out our Quarterly Forecasts as part of the DailyFX Trading Guides.
Stocks Not Yet Ready to Rally as the Wall of Worry Proves Too Tall to Climb
It was another bearish week for global stocks as the October/Q4 sell-off extended to fresh lows. While last week brought a backdrop for bullish reversals in US markets, that theme was negated throughout this week as risk aversion remained a key driver across global markets. As discussed on Wednesday, US corporates have started to point to impact from tariffs; and this, when combined with fears around continued rising rates in the US, may be a tipping point type of scenario that stopped that bullish breakout from last quarter dead in its tracks. And when also including the situation around Europe and Italy, along with continued mayhem around Brexit, and there’s just a lot to worry about at the moment that isn’t currently being offset by positive drivers.
Also of concern, the US is nearing mid-term elections in what could be classified as a volatile political environment. After the Dow Jones jumped by more than 50% from the lows of the 2016 Presidential Election up to the recent highs, change may be in the air as President Trump’s rival party looks to gain a majority in House of Representatives in two weeks. Should that happen, deeper political posturing could take place and this could provide further headwinds for US stocks and this is also likely taking a toll on the matter.
Below, we look into five of the more popular global equity indices ahead of next week’s price action.
S&P 500 Falls Below 200 Day Moving Average
This week was pretty nasty for the S&P 500, as bearish moves on Monday, Tuesday and Wednesday pushed prices well-below the 200 Day Moving Average. Up to this point, that moving average was an item of hope for S&P bulls as two weeks ago traders saw prices firm up to this level ahead of the weekly close, while last week saw prices hold support above this marker. This week, however, brought something different as sellers ran aggressively into Wednesday trading before a bit of support started to show over the past three days.
That support comes in around 2660; but it may not yet be strong enough to build bullish cases in the index. The lower-lows and lower-highs from the past 10 days remain, and traders may want to wait for a topside break, indicating short-term higher-highs before getting back on the bid. The forecast for next week will remain at neutral.
Technical Forecast for the S&P 500: Neutral
SPX 500 Daily Price Chart
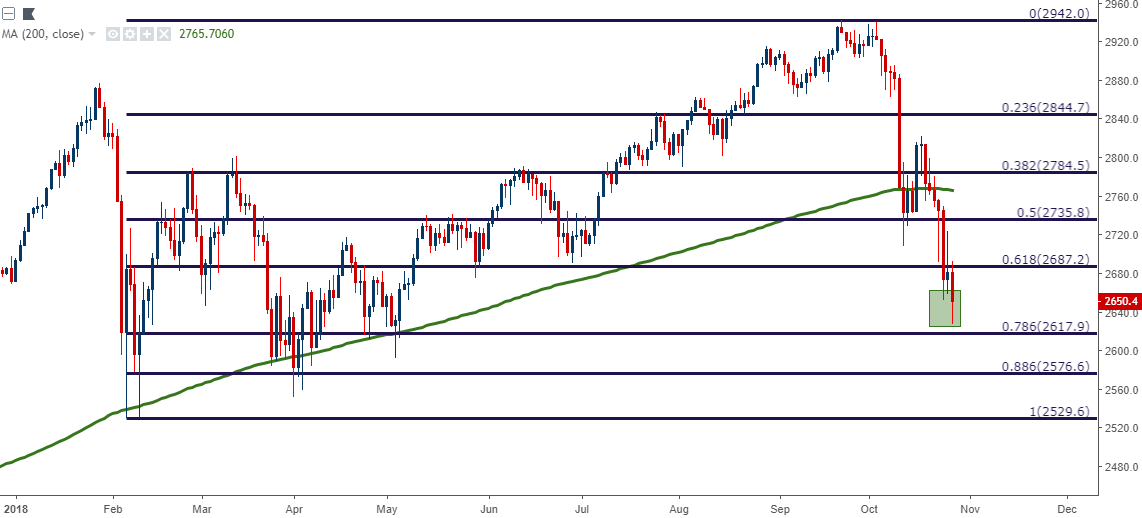
Chart prepared by James Stanley
Dow Holds 78.6 Support From the Q3 Bullish Move
While the S&P 500 is still finding a bit of resistance at the prior June swing low, the Dow Jones Industrial Average continues to hold on to gains from Q3. The index is currently finding some support around the 78.6% Fibonacci retracement of that move, and at the very least this provides some added interest in the bullish reversal theme.
But – this week’s price action brought the bearish items of a down-side break below the 200-Day Moving Average as well as the trend-line that held the lows in the index since late-June. Traders that are ok with aggressive bullish reversals could continue to look to the Dow given this build of support, and if this support holds through the Monday open, the door may soon re-open to bullish strategies. I’d like to first see a re-claim of the 61.8% retracement, which is confluent with that 200 DMA, before looking on the long side again. The forecast for next week will be set to neutral.
Technical Forecast for the Dow: Neutral
Dow Jones Daily Price Chart: Holding Around 2018 Open, 78.6% of Q3 Move

Chart prepared by James Stanley
FTSE 100 with Bearish Breakout Potential at 2018 Lows
The bearish theme continued in the FTSE 100 this week with yet another resistance test at the 76.4-76.8 Fibonacci area taken from the March-May bullish move in the index. This was followed by a break down towards the prior March low; but sellers were unable to test down to the actual level, leaving this exposed on the chart as a potential push point for short-side breakouts.
This can open the door to short-side breakouts upon prints to fresh lows; and the forecast on the index will be set to bearish for next week.
Technical Forecast for the FTSE 100: Bearish
FTSE 100 Daily Price Chart

Chart prepared by James Stanley
DAX Finally Finds Support – But Can it Hold
This is the area that I’ve been looking to for short-side plays in equities over the past few months. Coming into September, the DAX had started to put in bearish clues. But it was the October open and this recent round of global risk aversion that’s really made the short-side theme come alive here. Coming into September and then again in October, I was looking for resistance in the DAX off of the 23.6% Fibonacci retracement of the 2016-2018 major move. This week saw the 50% marker of that same move come into play; so quite the run in a very short period of time. There is no evidence yet of a low being in place; and thus, the forecast for next week will remain at bearish.
Technical Forecast for the DAX: Bearish
DAX Weekly Price Chart
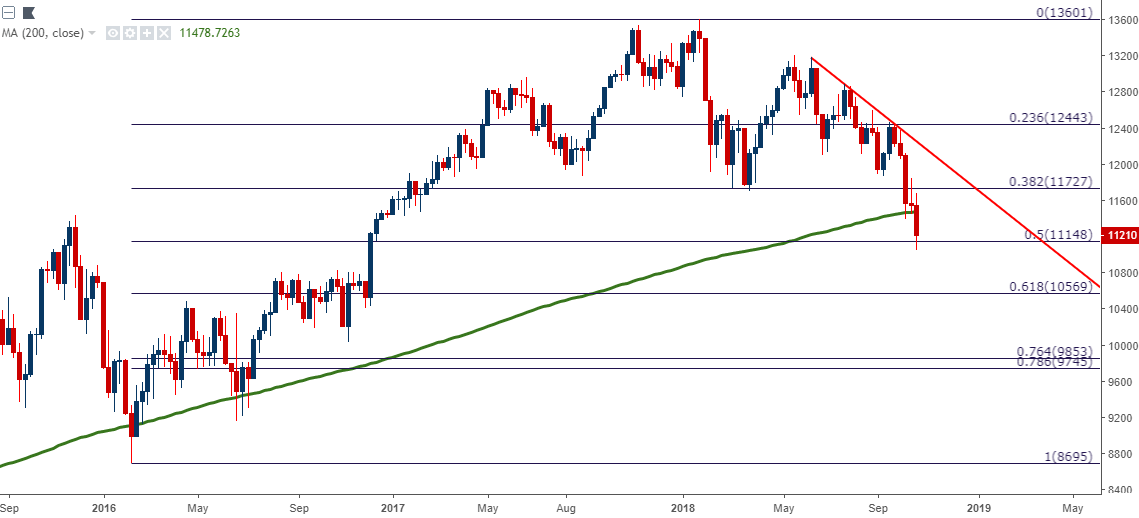
Chart prepared by James Stanley
Nikkei with a Nasty Week as the Q3 Breakout Now Completely Priced Out
The Nikkei has been rife with volatility over the past couple of months. In September, I had looked at a building ascending triangle formation that soon led into the forecasted bullish breakout. That bullish breakout ran with considerable strength as the index perched-up to fresh 27-year highs. And that theme of Nikkei strength even lasted into the first couple trading days of Q4.
But as global equity sell-offs started to show the world-around, the Nikkei was unable to escape unscathed, and last week saw prices revert back to a bullish trend-line that connects the swing-lows from the prior two years. A doji printing last week right at that trend-line kept the door open for bullish strategies, but that support level was blasted through this week as another gust of selling enveloped the index.
At this point, there’s no evidence yet of a low being in place; but prices do remain supported above the key point of prior resistance/support around 20,320. The forecast for next week will be set to neutral.
Technical Forecast for the Nikkei: Neutral
Nikkei Weekly Price Chart
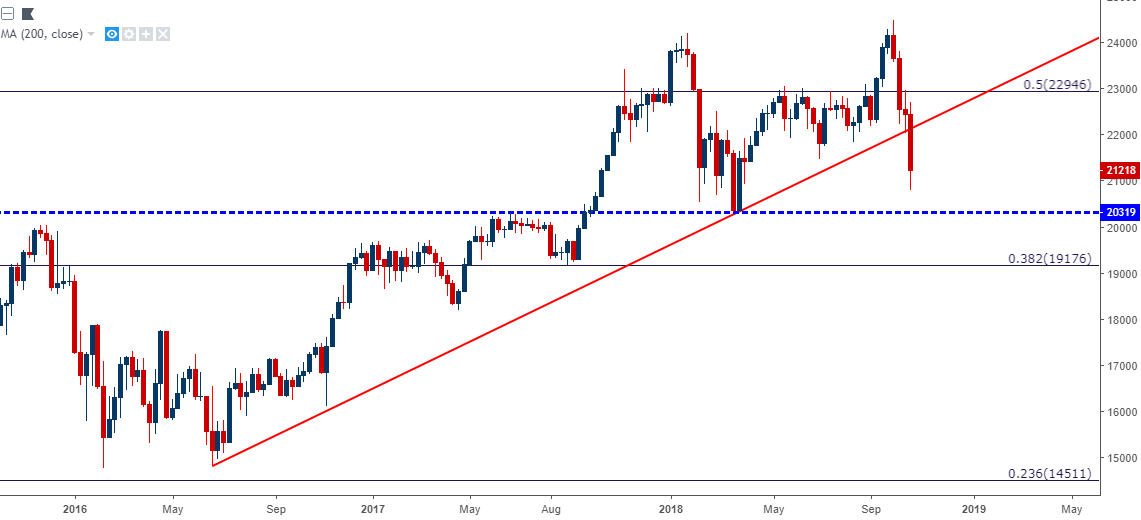
Chart prepared by James Stanley
To read more:
Are you looking for longer-term analysis on the U.S. Dollar? Our DailyFX Forecasts for Q1 have a section for each major currency, and we also offer a plethora of resources on USD-pairs such as EUR/USD, GBP/USD, USD/JPY, AUD/USD. Traders can also stay up with near-term positioning via our IG Client Sentiment Indicator.
Forex Trading Resources
DailyFX offers a plethora of tools, indicators and resources to help traders. For those looking for trading ideas, our IG Client Sentiment shows the positioning of retail traders with actual live trades and positions. Our trading guides bring our DailyFX Quarterly Forecasts and our Top Trading Opportunities; and our real-time news feed has intra-day interactions from the DailyFX team. And if you’re looking for real-time analysis, our DailyFX Webinars offer numerous sessions each week in which you can see how and why we’re looking at what we’re looking at.
If you’re looking for educational information, our New to FX guide is there to help new(er) traders while our Traits of Successful Traders research is built to help sharpen the skill set by focusing on risk and trade management.
--- Written by James Stanley, Strategist for DailyFX.com
Contact and follow James on Twitter: @JStanleyFX
Other Weekly Technical Forecast:
Australian Dollar Forecast: AUD/USD Price Sets Up for a Rise, GBP/AUD Risks Extending Reversal
British Pound Forecast: GBPUSD Short-Term Chart Looks Oversold
US Dollar Forecast: Dollar Advancing to 16-Month Highs Depends on Its Preferred Correlation