


Dollar Technicals Talking Points:
- The DXY Dollar Index charged a 5-day rally this past week, bring the currency near 2-year highs
- While the week’s performance is strong, the ATR and channel boundaries restrict expectations
- See how retail traders are positioned in key Dollar pairs like EURUSD, GBPUSD, USDJPY as well as gold, oil, indices and other key FX pairs in real time
Technical Forecast for Dollar: Neutral
The US Dollar ended a remarkably strong week through this past Friday. While the move did not secure the coveted historical reference to a fresh two-year high, the rally proved an especially bright spot against the contradiction of fundamental troubles that seemed to be cast aside with the performance. Where risk trends firmed against the currency’s haven status and interest rate forecasts floundered for the Fed, the benchmark currency still managed the consistent gains. While technical traders may shrug at the lack of consistency between the USD’s movement and those from volatility measures or implied yields derived from Fed Funds futures, those conditions lead to the lack of clear momentum that we have suffered from the benchmark. Without a clear motivation for market participants to follow, it will be difficult to translate a move above 98.35 for the DXY – what would be a two-year high – into an opportunity of meaningful follow through. The same restraint would arise should the market make a seismic move in the opposite direction. Then again, volatility within the bounds of the rising trend channel fits comfortably within the market’s activity level.
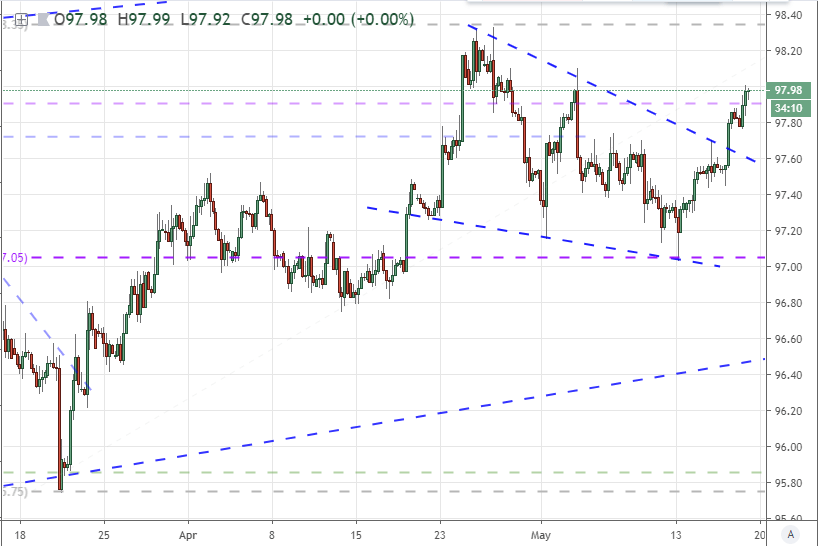
Starting with our analysis of the Dollar on the lower time frame, there was certainly ‘trading’ going on in the market this past week. The DXY Index managed to breach a few noteworthy technical levels on the four-hour chart, following an impressive reversal to start the week. With a precision reversal off the mid-point of the March to April bullish phase at 97.05 it looked like there was an acute attention being paid to the technical milestones. That would make 97.70 a capable point of acceleration as the top of a wedge and range high from the previous week. Sure enough, the break was good for some follow through. Now, heading into the new week, we are within easy reach of the 98.10/35 which represents the high going back to May 2017.
Chart of DXY Dollar Index (4-Hour)
Given that we cannot see the technical barriers above the late April highs on such a low time frame, we can step it up to a daily and weekly time frame to set next levels of importance. On the daily, it is still difficult to garner a sense of what traders would use as their guidelines. That is important to note as much technicians tend to restrict their trading time frames to less than a few weeks and in turn don’t encompass enough historical data to find reference to more distant technical levels. That means they will look for measures of extension like the top end of the rising trend channel which could optimistically project to the 98.85 area. More likely, traders will make calculated measures off of previous bull legs, and that will produce a choppy and uncertain projection itself. In short, it will be a struggle to rally the bulls to a sweeping run which makes breakout opportunities far less potent.
Chart of DXY Dollar Index (Daily)

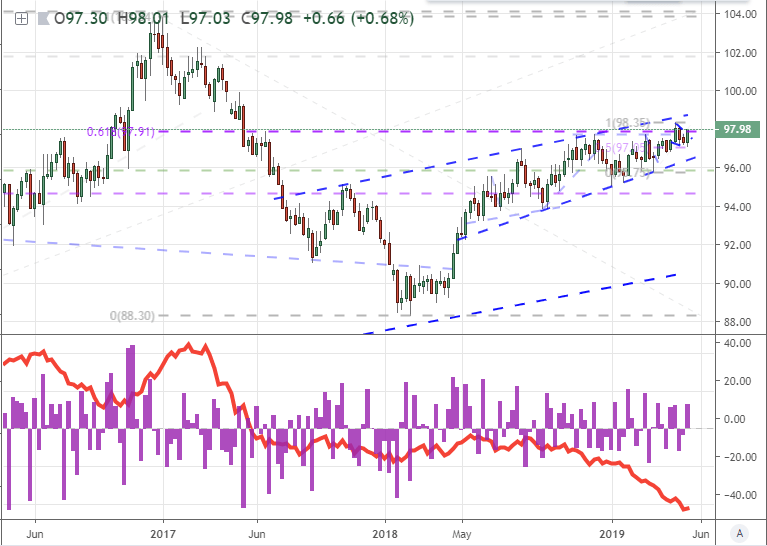
On the weekly time frame, we start to see the reference points for realized price levels that could serve as technical overhead to pull bullish interests towards or catalyst points should they break. Beyond the 98.35 break, we find here was considerable hesitation around 99.20/40 which was more heavily used as ‘neckline’ support to a five-month head-and-shoulders pattern. There was further a large double top in 2015 around 100.30 and 2017’s high was set at 103.85 at the beginning of that year. These are all very prominent levels, but it is would be a hard fought move to return to those levels. Alternatively, a reversal within the channel is naturally a ‘path of least resistance’. That means it would take far less convincing and it could also find follow through more readily as the requirement for movement would be much lower. Beyond the previously mentioned 97.05 midpoint as first level support, the big figure would be the channel floor and 200-day moving average currently stationed around 96.50.
Chart of DXY Dollar Index and 1-Week Rate of Change and 20-Week ATR (Weekly)
Rather than just looking at levels, we should consider the ‘nature’ of the market for which we are dealing. There is considerable restraint whether we reference a measure of the Dollar that is trade-weighted (heavily skewed towards EURUSD and liquidity issues) or an equally-distributed measure. The week-by-week movements have been large on occasion, but they tend to switch directions regularly which impedes progress. That is not a particularly effective means for establishing trends surely. Both measures of the USD show general activity levels (ATR) are as restricted as what we suffered through back in the Summer of 2014. Below, we have the equally-weighted Dollar measure and you can see it is actually making a move to two-year highs, which could encourage more enthusiasm than the occasion deserves. Consider the market’s ability to establish pace before setting far flung and unrealistic objectives.
Chart of Equally-Weighted Dollar Index and 1-Week Rate of Change and 20-Week ATR (Daily)
Considering the restricted nature of the Dollar – and this is generally true of all currencies and assets – it is worth looking to a few standout majors to evaluate expectations. GBPUSD has made a remarkable move itself, extending a slide to 2019 lows with a near consistent tumble over the past weeks. This has been the worst week’s drop since February 2018. While the Sterling has been the principal driver of this theme and the Brexit issues are volatile, reversion could prove a strong force in any pause ahead of the EU Parliamentary election results.
Chart of GBPUSD and 10-Day Rate of Change (Daily)

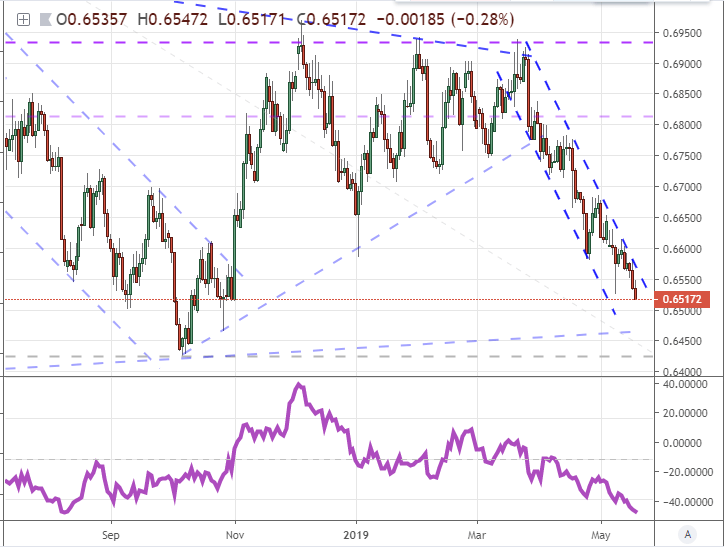
We could similarly point to AUDUSD with a similar backdrop with a drop to multi-year lows spurred to the connection to China. However, I like NZDUSD as it is a little more distant from the distortion of the fundamental themes and it is just as impressive a slide while still having a technical boundary in sight. The 40-day (2-month) rate of change to the downside is the worst since August as the October swing low around 0.6425 comes into sight. This is not assured to hold but a bullish breach of such a steep bearish channel could inspire some speculative fervor to work with.
Chart of NZDUSD and 40-Day Rate of Change (Daily)
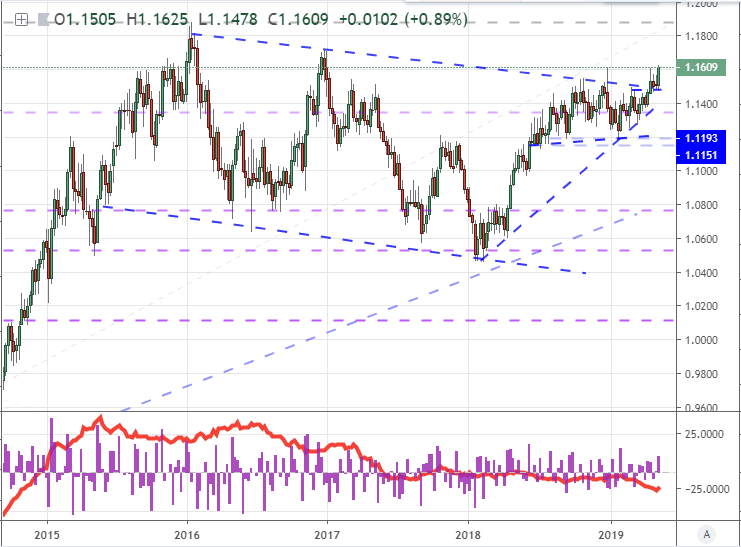
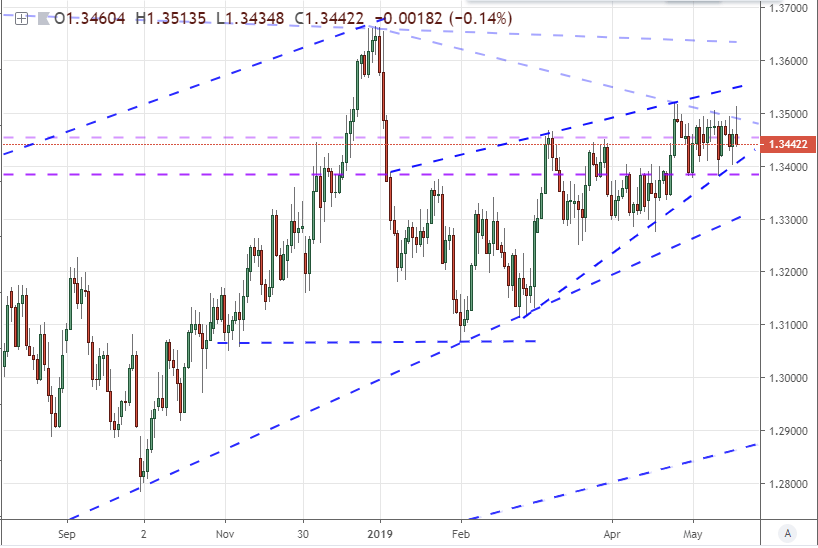
And, rather than looking for the most amplified trend or reversal threats, we can also consider the setup from USDCAD. The pair has proven stubbornly consistent in its range between roughly 1.3500 and 1.3400 despite a number of fundamental sparks that could inspire any number of runs. This pair is working its way into a number of terminal wedges and it is hard to believe that it will continue to defy the influence of the other Dollar majors – especially if the currency catches a strong wind. Range trading may not be lucrative, but it is consistent, yet the breakout may serve impressive run relative to distended majors like EURUSD or USDJPY.
Chart of USDCAD (Daily)
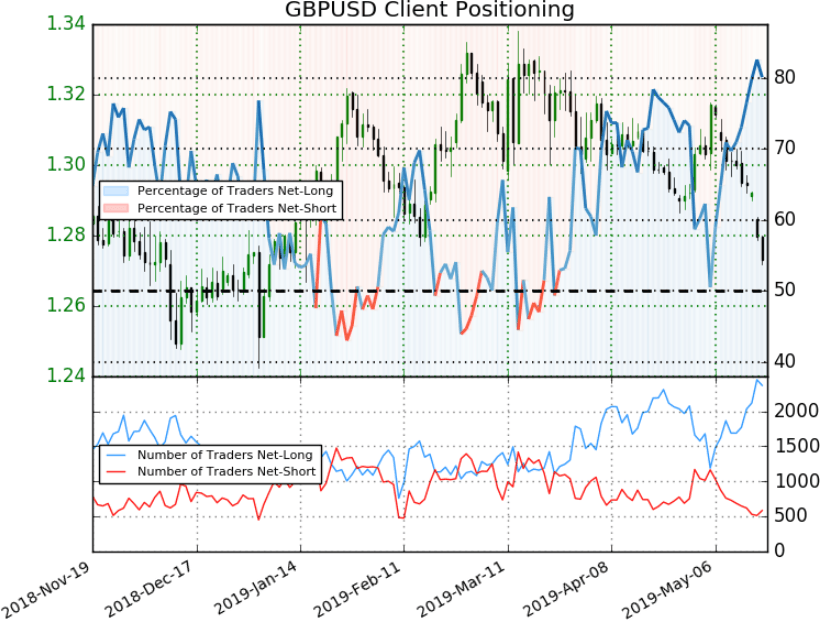
Finally, a look to speculative positioning finds there is neither speculative momentum or strong contrarian measure on aggregate via the large speculative futures crowd. While still sporting a net long view, we are still significantly off the highs in net long interest from November/December. In the shorter term interest of retail traders, we see some clear effort to fade strong trends among certain benchmark pairs. The GBPUSD for example has over 80 percent of the retail sample holding long positions looking for a turn – so an antidollar bias. Set expectations accordingly.
Chart of Net Speculative Positioning in Aggregate Dollar Futures from CFTC Report (Weekly)
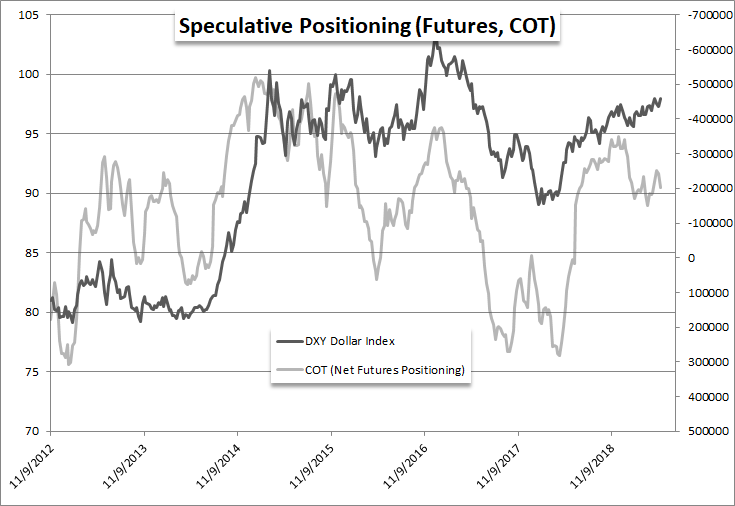
Chart of Retail Trader Positioning from IG Clients (Daily)
Looking for a fundamental perspective on the Dollar? Check out the Weekly USD Fundamental Forecast


