


Australian Dollar Technical Highlights:
Check out the intermediate-term fundamental and technical outlook for major markets and currencies in the DailyFX Quarterly Forecasts.
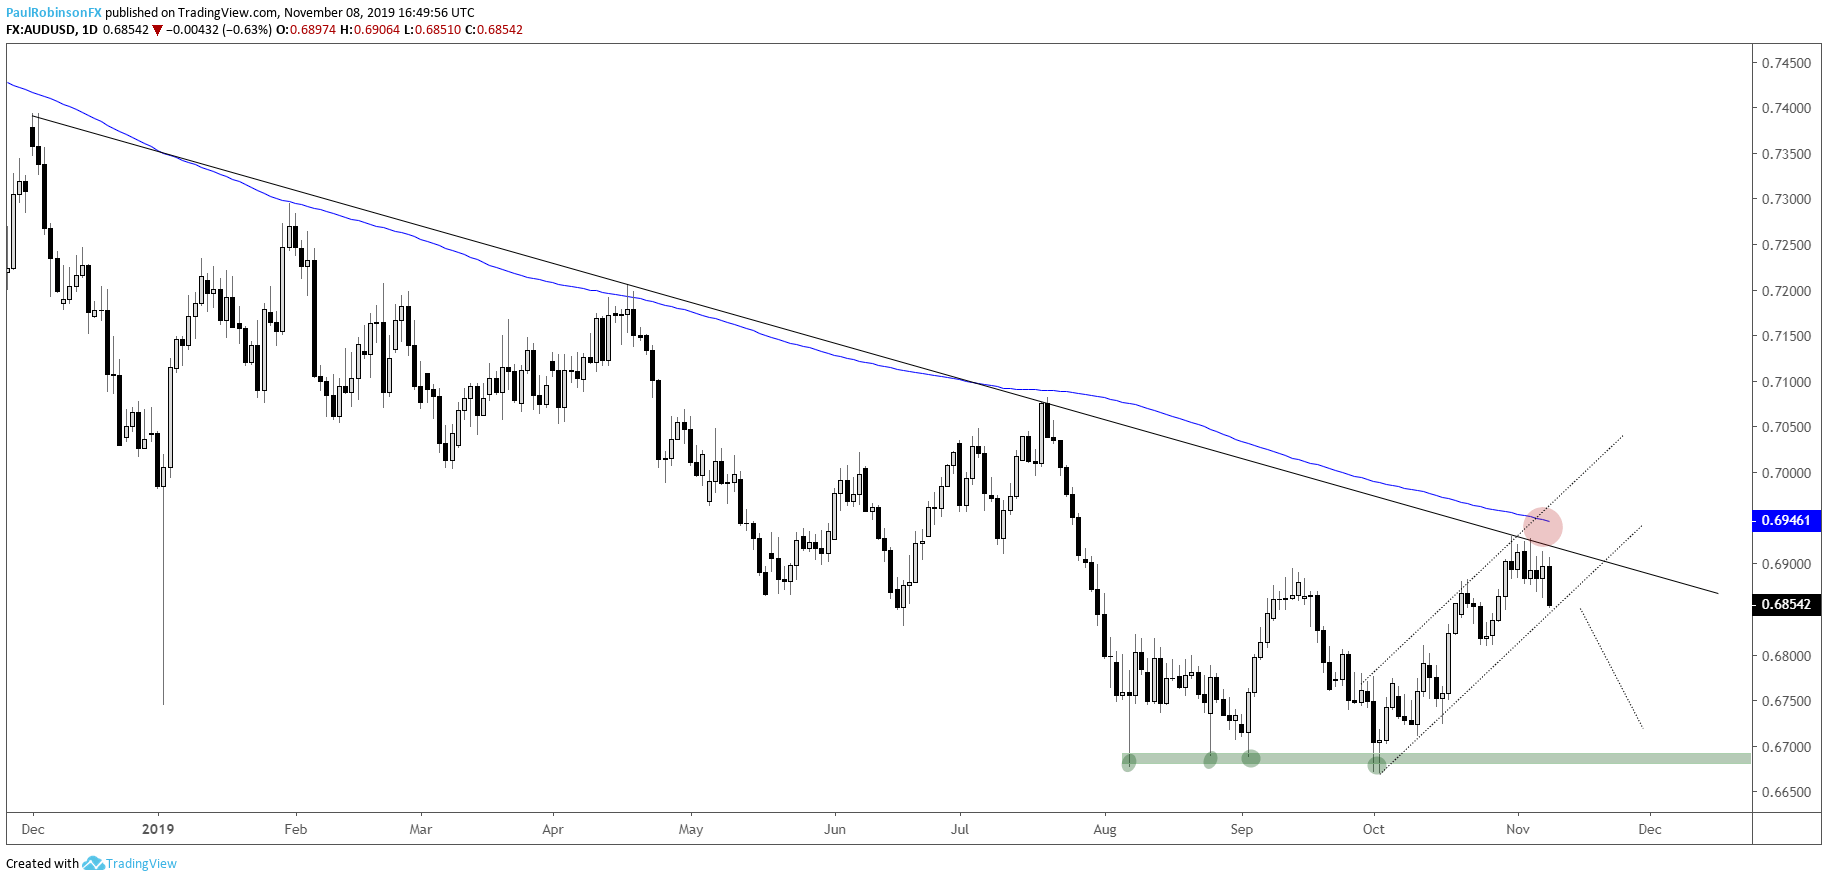
AUD/USD support-break seen as selling catalyst
AUD/USD recently ran aground into trend-line resistance dating back to a peak created in December. The trend-line runs over peaks in April and July, and further cementing it as a worthy level of resistance is the 200-day which runs over several peaks during the course of the past year.
This sets Aussie up to drop in-line with the broader downtrend in place since February 2018. A break through the lower parallel of the bullish channel off the October low will add a level of confirmation to the set-up. In short, respect long-term resistance, break short-term bullish sequence to get things rolling towards lower levels.
In the next week, should we see a convincing breakdown, the 6700/6670 zone will be targeted. It may take some time to reach support, but then again selling could come in as it did in late July, early August. To turn the picture bullish a good deal of work is needed. For starters, a breakout above the October 31 high at 6929 along with a crossing of the December trend-line and 200-day.
AUD/USD Daily Chart (watch for channel break)
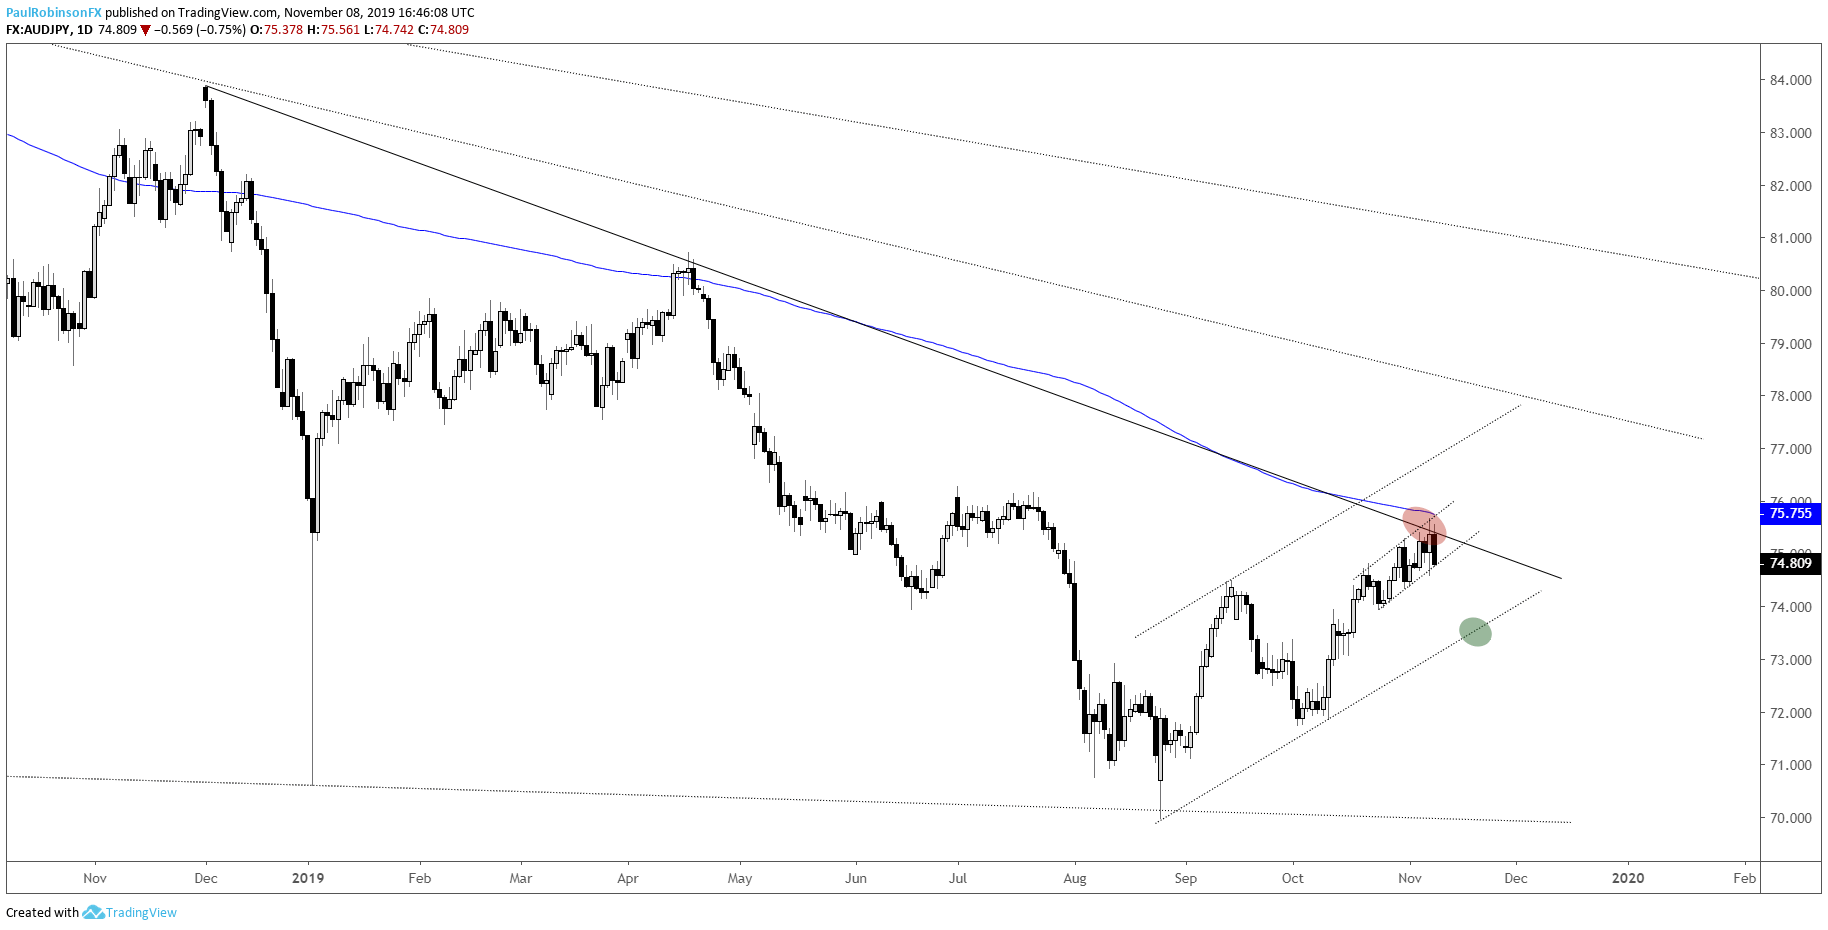
AUD/JPY turning off resistance, watching 4-hr chart
AUD/JPY is up against a sturdy ceiling of resistance – the December trend-line and 200-day MA are aligned in confluence, much in the same way as AUD/USD (unsurprisingly). The key here is to watch how the near-term trend continues to develop.
Turning to the 4-hr time-frame, upward price action is taking on the shape of a rising channel that signals a lack of momentum as resistance looms. A break of the lower parallel and 7456 should be enough to snap the near-term bullish bias. The first target will be the trend-line rising up from the August low.
AUD/JPY Daily Chart (confluent trend resistance)
AUD/JPY 4-hr Chart (break of 7456 needed to tilt lower)

Forex & CFD Trader Resources
Whether you are a new or experienced trader, we have several resources available to help you; indicator for tracking trader sentiment, quarterly trading forecasts, analytical and educational webinars held daily, trading guides to help you improve trading performance, and one specifically for those who are new to forex.
---Written by Paul Robinson, Market Analyst
You can follow Paul on Twitter at @PaulRobinsonFX


