
USD/JPY Price Outlook
- Bullish recovery yet with reluctance
- Signals and trading zones to monitor
Recovered Losses
On April 1, USD/JPY printed 106.92 - its lowest level in two weeks. However, the price rallied after and settled above 107.00 handle. On Friday, the market closed the weekly candlestick in the green with 0.5% gain.
This week, the Relative Strength Index (RSI) crossed above 50, then remained flat highlighting the end of downside move on one hand, and the lack of impulse to start uptrend move on the other.
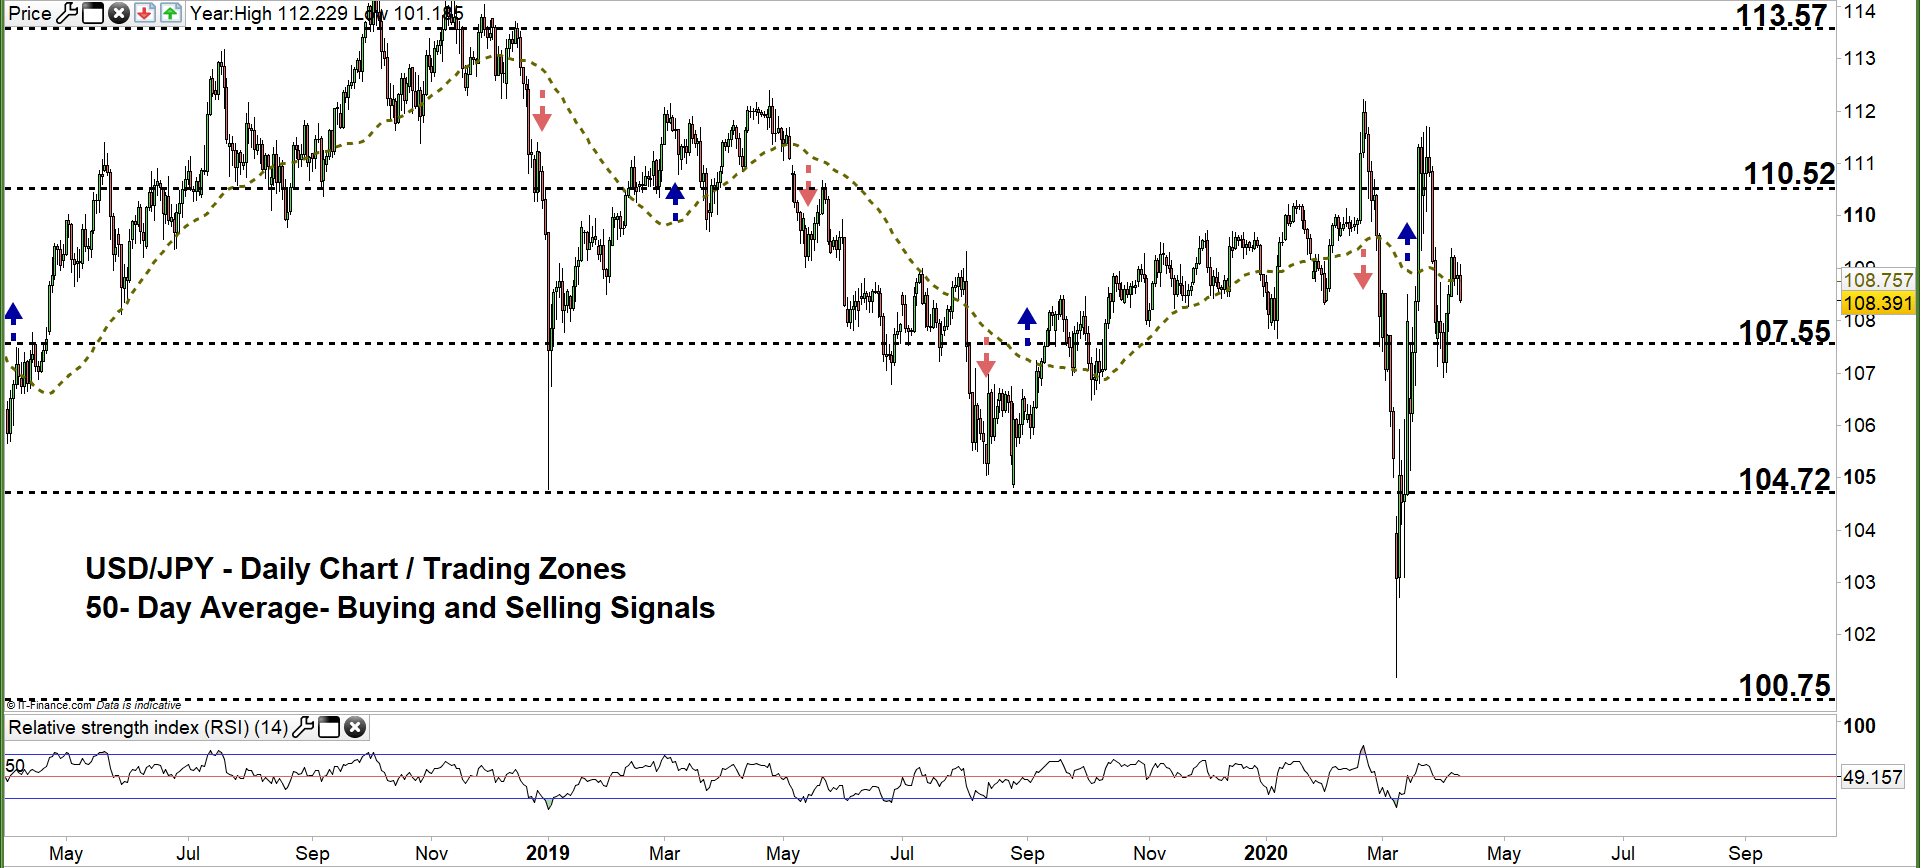
USD/JPY DAILY PRICE CHART (April 31, 2018 – APril 9, 2019) Zoomed out

USD/JPY DAILY PRICE CHART (MAY 1 – AUG 9, 2019) Zoomed in

Looking at the daily chart, we notice that on Thursday USD/JPY climbed to current trading zone 107.55- 110.52. On Tuesday, the price paused its rally and pointed lower. However, the market did not generate any bearish signal as the pair has not closed below the 50-day average yet.
A close below the low end of the zone could see USDJPY trading towards 104.72. Further close below that level could send the pair even lower towards 100.75. Having said that, the weekly support levels and area marked on the chart (zoomed in) should be kept in focus.
On the flip-side, any failure in closing below the low end of the zone may reverse the pair’s direction towards the high end of the zone. Further close above that level could mean more bullishness towards 113.57. In that scenario, the weekly resistance levels underscored on the chart should be monitored.

USD/JPY PRICE four hour CHART (Mar 13– April 9, 2019)
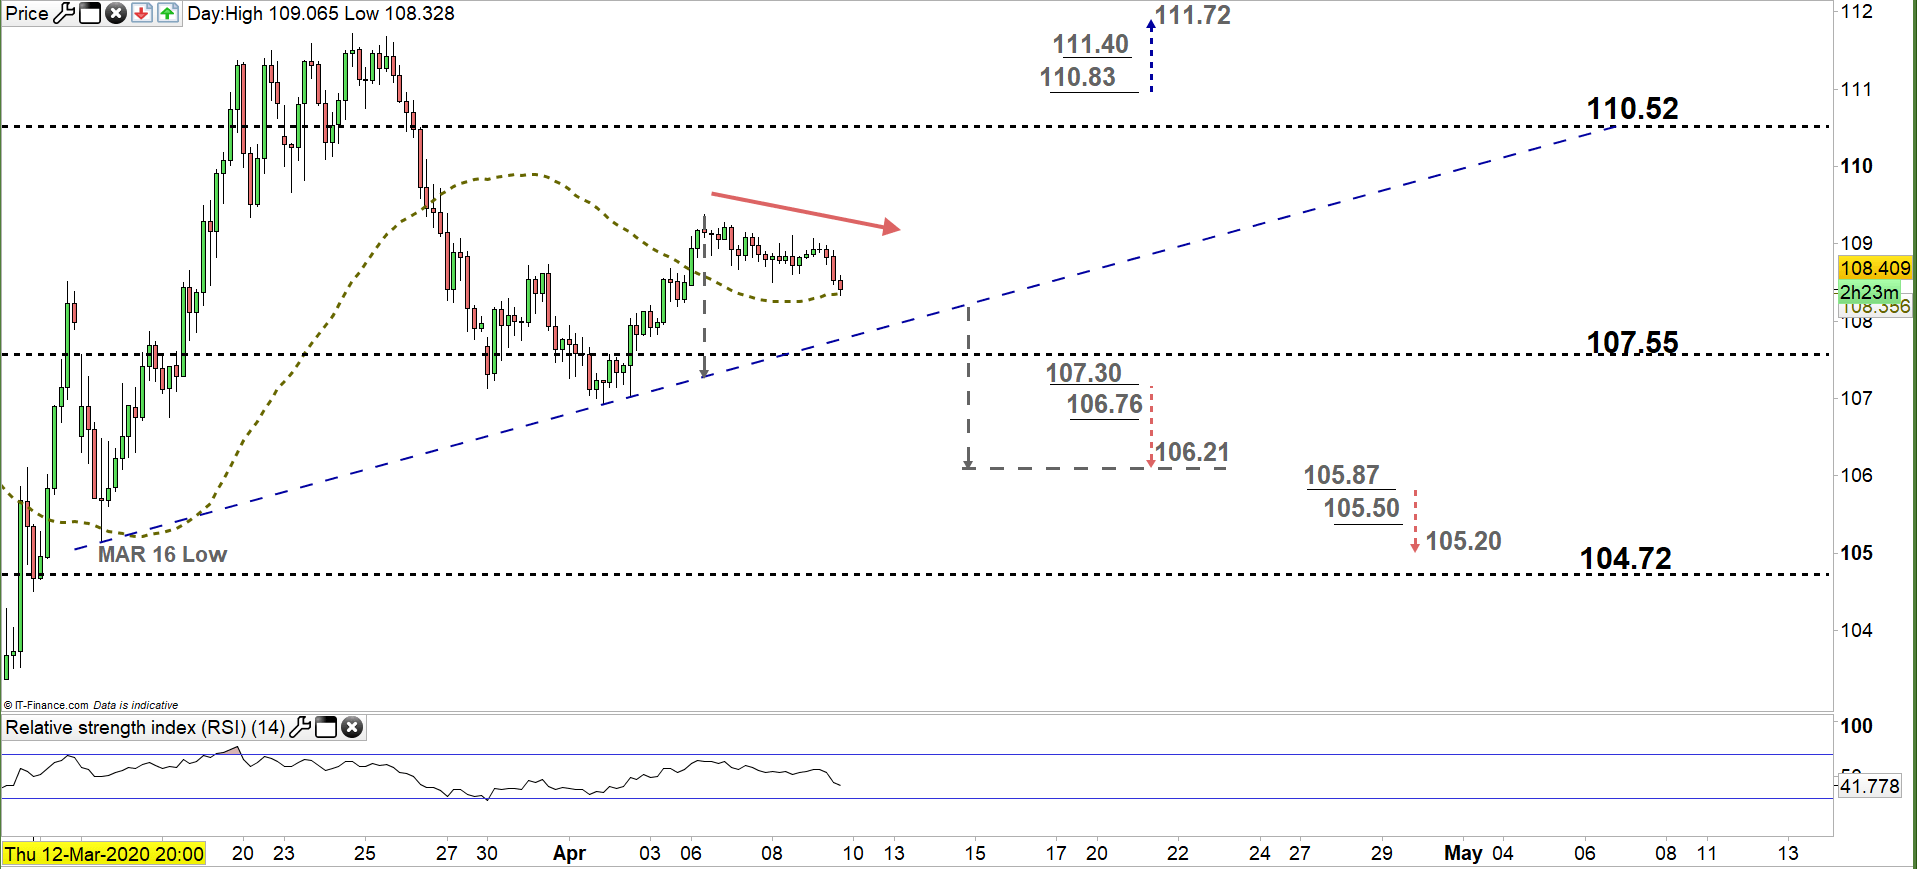
Looking at the four-hour chart we noticed this week USD/JPY has peaked at 109.38 then started a downside move creating lower highs with lower lows. Currently, the price trades above the uptrend line originated from the March 16 low at 105.14. Any violation to this line would be considered a bearish signal.
A break below 107.30 would be considered another bearish signal. This increases the likelihood of falling towards 106.21. Although, the daily support level underlined on the chart should be considered. In turn, any break in the other direction i.e. above 110.83 may cause a rally towards 111.72. Nevertheless, the resistance level printed on the chart should be watched closely.

Written By: Mahmoud Alkudsi
Please feel free to contact me on Twitter: @Malkudsi