US Dollar (DXY) Price, Chart and Analysis.
- Weekly pull-back now faces resistance.
- DXY likely to consolidate before the next break.

US Dollar Supported by a Cluster of Support Levels
The US dollar faces an interesting week ahead with little heavyweight data to lean on until the March durable goods release next Friday. While official data remains important, markets have seemingly priced-in worst case scenarios. Recent US jobless claims have hit multi-decade records but the greenback continues to push higher as demand for haven assets remain. With the Fed flooding the market with US dollars via different programs, the demand for USDs may soon be slated, removing one of the US dollars major drivers.
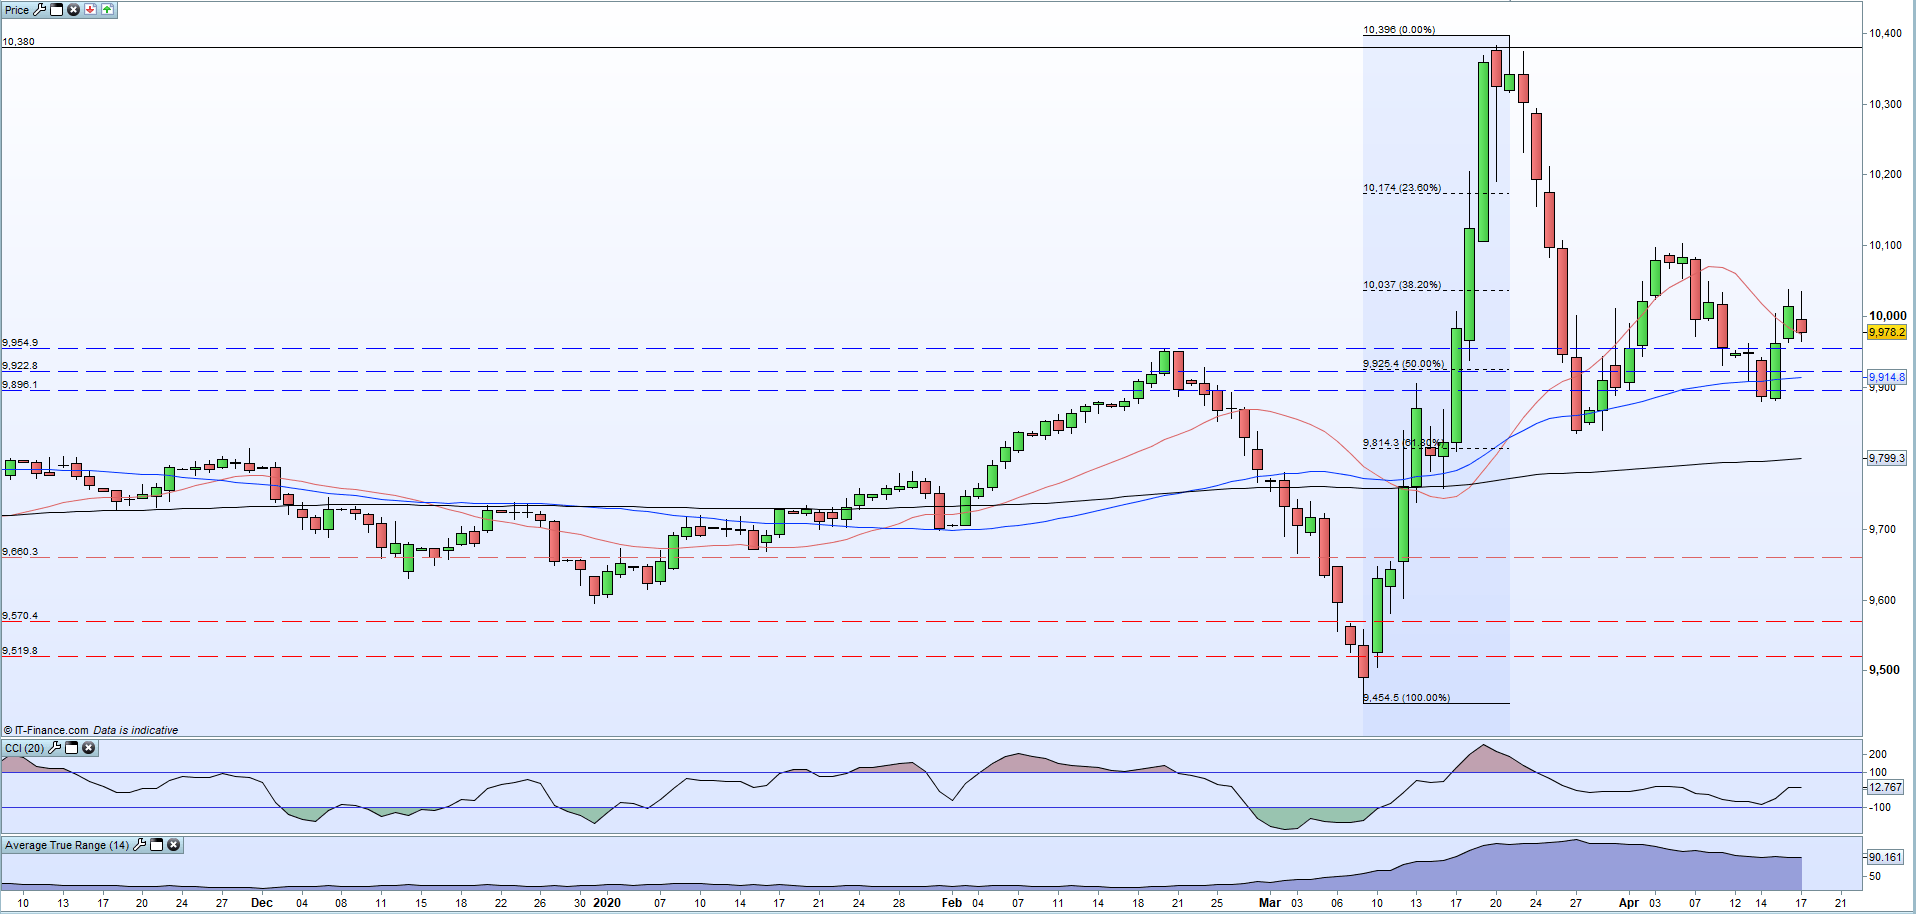
The technical set-up for the US dollar basket (DXY) is interesting with a cluster of support and resistance levels either side of the current spot price. The chart also shows the DXY trading range narrowing with lower highs and higher lows being made over the last month. The longer that this remains the case, the greater the possibility of a range break, especially while volatility levels remain near there recent peaks. With this in mind, the outlook for the US dollar next week remains neutral.
The chart shows the US dollar also trading between two Fibonacci retracement levels made off the March9 to March 22 surge. Resistance is seen off the 38.2% level at 100.37, a level tested but not conclusively broken, while support is seen from the 50% retracement level at 99.25, a level that has been broken before but is currently holding. Below here, support comes off the 50-dma at 99.15 and a pair of lows around 98.80. If the USD does break higher, and closes above 38.2% Fib, then April 6 swing high at 101.05 will be exposed before 101.74 and above.
US Dollar (DXY) Daily Price Chart (October 2019 - April 17, 2020)

Traders may be interested in two of our trading guides – Traits of Successful Traders and Top Trading Lessons – while technical analysts are likely to be interested in our latest Elliott Wave Guide.
What is your view on the US Dollar – bullish or bearish?? You can let us know via the form at the end of this piece or via Twitter @nickcawley1.