Crude Oil Price, Chart and Outlook.
- Fibonacci and moving-day average resistance now in play.
- Volatility remains at extreme levels.
| Change in | Longs | Shorts | OI |
| Daily | -5% | -3% | -4% |
| Weekly | -11% | 22% | 2% |
Crude Oil – Rebound Running Out of Steam
Crude oil continues to be roiled by the impact of the coronavirus on global growth, highlighted this week by several countries entering recession, while the lack of storage facilities makes trading oil futures a particularly dangerous game, especially when front-month contracts have the ability to turn negative. The pick-up seen in the last 9 days - from lows never seen before - looks unconvincing and needs a dose of fundamental good news to underpin the move.
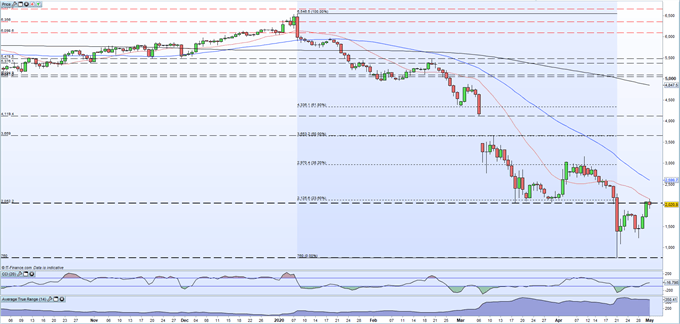
The move off the $7.60/bbl. low has now met resistance and today’s tepid performance does not bode well. A combination of 23.6% Fibonacci retracement at $21.25/bbl. and the 20-day moving average at $21.60/bbl. has capped the recent rally and both levels will need to broken convincingly to allow further upside. Above here, the 50-dma at $25.97/bbl. and the 38.2% Fibonacci at $29.70/bbl. will prove much harder to overcome.The ATR indicator shows that extreme levels of volatility remain in the oil complex and with double-digit percentage moves commonplace over the last two weeks, traders need to carefully consider the amount of volatility in the market and if it suits their risk profile.
The two bullish candles seen on Wednesday and Thursday this week will limit downside price action in the short-term, while the Tuesday’s long-legged doji suggests a bullish price reversal is taking shape. The last four daily candles have produced higher highs and higher lows, another positive sign, but today’s lack of price movement suggest uncertainty may be returning. A further technical move higher cannot be ruled out but unless it is driven by solid fundamentals, the risk of further sell-offs remain elevated.


US Crude Oil Daily Price Chart (October 2019 – May 1, 2020)

Traders may be interested in two of our trading guides – Traits of Successful Traders and Top Trading Lessons – while technical analysts are likely to be interested in our latest Elliott Wave Guide.
What is your view on Crude Oil – bullish or bearish?? You can let us know via the form at the end of this piece or via Twitter @nickcawley1.


