

GOLD PRICE WEEKLY TECHNICAL FORECAST – NEUTRAL
- Gold price action plunged -2% this past week on balance as precious metals come under fire
- Gold and silver volatility readings recoil lower and hint at potential for more weakness ahead
- Gold bears may challenge a key technical support level with yields and the US Dollar firming
- Visit the DailyFX Education Center to learn more about technical analysis and chart patterns
Gold price action faced renewed selling pressure this past week and notched a -2% decline from last Friday’s close. The precious metal stumbled sharply lower alongside silver prices as the US Dollar strengthened broadly and ten-year Treasury yields climbed to 117-basis points. Not to mention, gold and silver implied volatility readings have slid notably. This points to another possible force weighing negatively on precious metals given the typically strong positive relationship between implied volatility and spot prices.
GOLD PRICE CHART: WEEKLY TIME FRAME (18 MAR 2019 TO 05 FEB 2021)
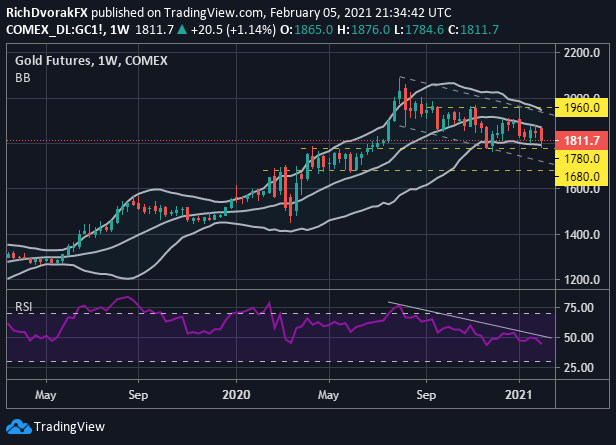
Chart by @RichDvorakFX created using TradingView
As such, there seems to be potential for gold price action to remain under pressure and continue its counter-trend pullback. The downward-sloping relative strength index also suggests gold bears are still in control of medium-term direction. Following the latest extension lower, which coincided with a rejection of the 20-week simple moving average, gold prices now hover near the $1,810-mark.
| Change in | Longs | Shorts | OI |
| Daily | 2% | 11% | 6% |
| Weekly | 5% | 0% | 2% |
This is slightly above a critical area of technical support around the $1,780-price level underpinning swing highs notched last April and May as well as November lows. Gold bulls might look to defend this support zone also aligning with the bottom Bollinger Band in addition to the 38.2% Fibonacci retracement level of the trading range since the 2019 low. If this potential support level fails to keep gold prices afloat, however, the precious metal might extend lower toward the $1,680-level.
GOLD PRICE CHART: DAILY TIME FRAME (03 SEP 2020 TO 05 FEB 2021)

Chart by @RichDvorakFX created using TradingView
Shifting gears to a daily gold chart, we see bearish momentum behind recent gold price action is accelerating. This is highlighted by the MACD indicator. Further, the latest rejection of the 50-day and 200-day simple moving averages likely serves as another constructive technical development for gold bears. If a gold price rebound comes into play, however, traders could look to the 38.2% Fibonacci and mid-point retracement of the 09 November to 30 November trading range as a possible topside objective.

-- Written by Rich Dvorak, Analyst for DailyFX.com
Connect with @RichDvorakFX on Twitter for real-time market insight