
Euro Technical Forecast: Bearish
- EUR/USD is mixed as this week brought a fresh two-month low, but Friday printed as a bullish engulfing bar, which is often approached with the aim of strength.
- EUR/JPY is also mixed as a shorter-term rising wedge (bearish) runs counter to a possible ascending triangle and inverse head and shoulders pattern (both bullish).
- EUR/GBP is bearish, with support showing at a key level following a break down to eight-month lows.
- EUR/CAD is similarly bearish following this week’s resistance inflection from a prior support trendline.
- The analysis contained in article relies on price action and chart formations. To learn more about price action or chart patterns, check out our DailyFX Education section.
The start to February was really bad for the Euro coming into Friday, as the single currency has given up ground to all of the US Dollar, the Japanese Yen, the British Pound and the Canadian Dollar. On the final trading day of the week, however, helped along by an anemic NFP print that saw a massive negative revision to the prior month’s print – the Euro clawed back some of those losses in each of those pairs, and against the US Dollar, there was even a bullish engulfing candlestick that may suggest a reversal in the coming days in the major pair.
Below, I look into each of EUR/USD, EUR/JPY, EUR/GBP and EUR/CAD.
EUR/USD Slips Below 1.2000, Jumps Back Above
I was a bit surprised that 1.2000 didn’t put up a better fight when sellers were pushing EUR/USD down to a fresh two-month-low last week. This price gave a strong resistance inflection when it came back into the picture last September, amounting to a pullback that ran for almost 400 pips. On Thursday sellers went on attack, driving the pair below 1.2000 and running all the way down to a fresh low at the 1.1950 area.
Friday produced some change, and based on the way that this closes, that change may have potential for continuation. Friday price action is currently showing as a bullish engulfing candlestick, which will often be approached with the aim of following that bullish momentum. If we do get completed confirmation of that formation, which would require a weekly/daily close over the 1.2036 level that marked the Thursday open, and potential can remain for a bullish move up to a re-test of the 1.2134-1.2167 zone.
To learn more about the bullish engulfing pattern and why traders often approach with the aim of bullish continuation, check out DailyFX Education
EUR/USD Daily Price Chart
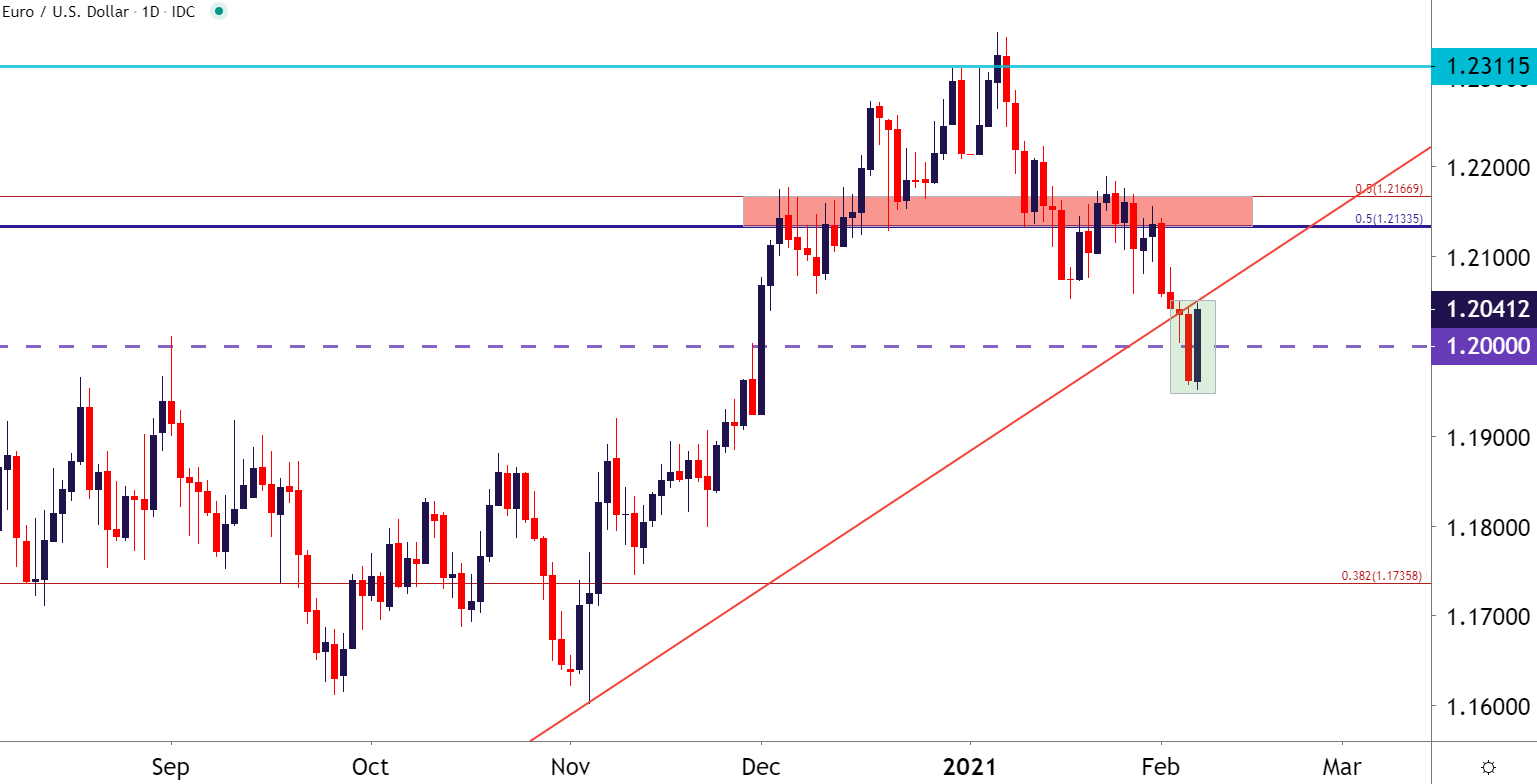
Chart prepared by James Stanley; EURUSD on Tradingview
EUR/JPY Tests a Big Resistance Level
For the past couple years, EUR/JPY has very much been a trending market. From September of 2018 into May of 2020, that trend was decisively bearish, with sellers driving the pair from above 133.00 to below 115.00. But that began to shift last summer and continued through the fall and into the New Year. Bulls have helped to bring the pair back to life but, there’s been a recent stumbling block that they haven’t been able to overcome and this very much plays into current day price action.
That price level is at 126.82, and its shown varying forms of resistance since last August.
EUR/JPY Weekly Price Chart
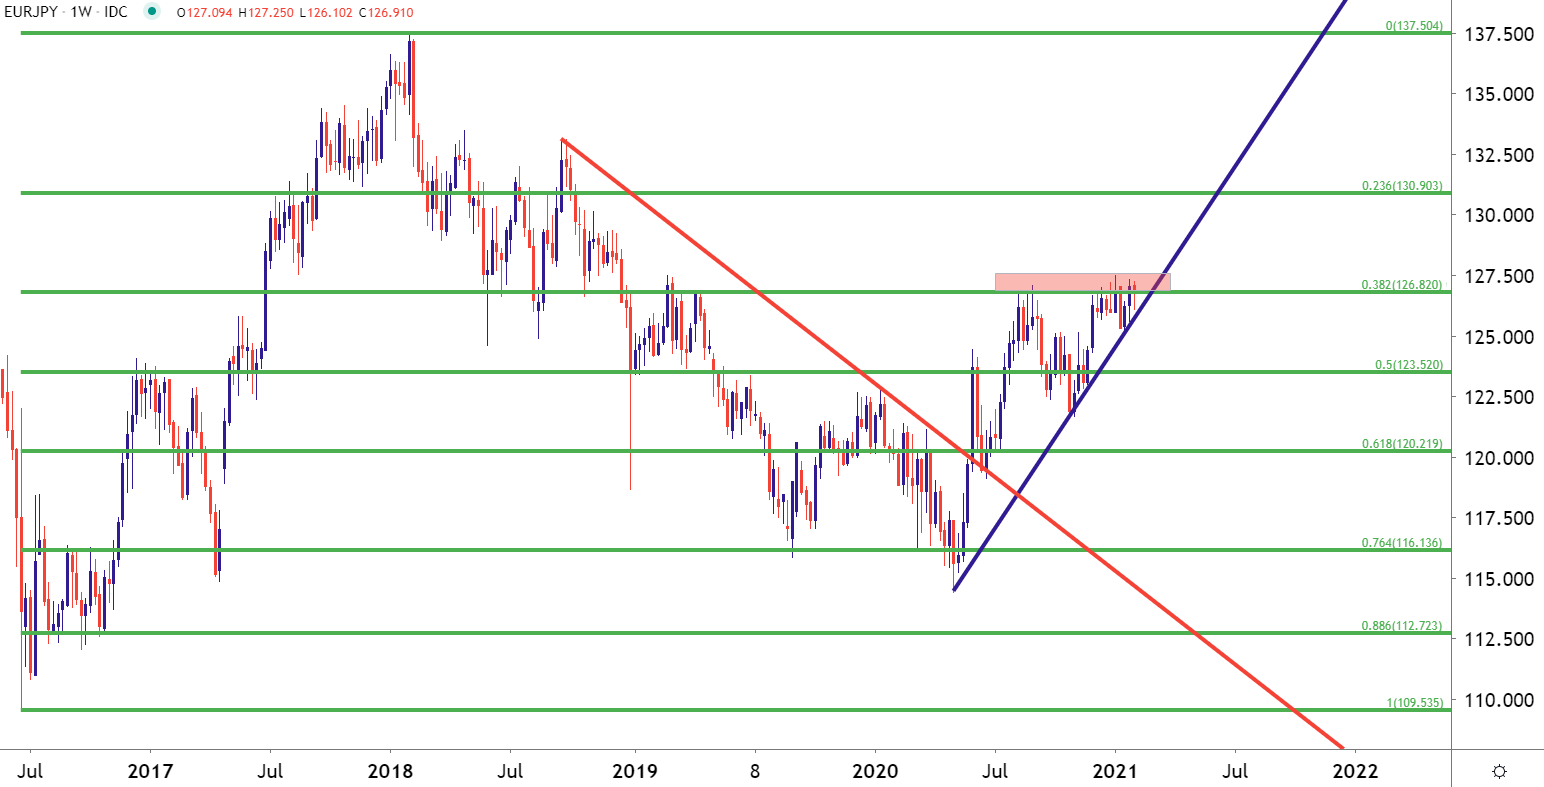
Chart prepared by James Stanley; EURJPY on Tradingview
Pick Your Formation to Decide Your Direction
Thickening the drama around that resistance, there’s a couple of different ways that this could be construed and there’s a few possible formations that traders could read into here.
From a shorter-term basis, taking those recent tests of resistance along with the slightly higher-highs that have printed; and couple that trendline with a support trendline offering a far more aggressive slope, and we have a potential rising wedge pattern. The rising wedge will often be approached with the aim of bearish reversals and this is one possible approach on the pair.
To learn why the rising wedge is often approached with the aim of bearish reversals, check out DailyFX Education
EUR/JPY Eight-Hour Price Chart
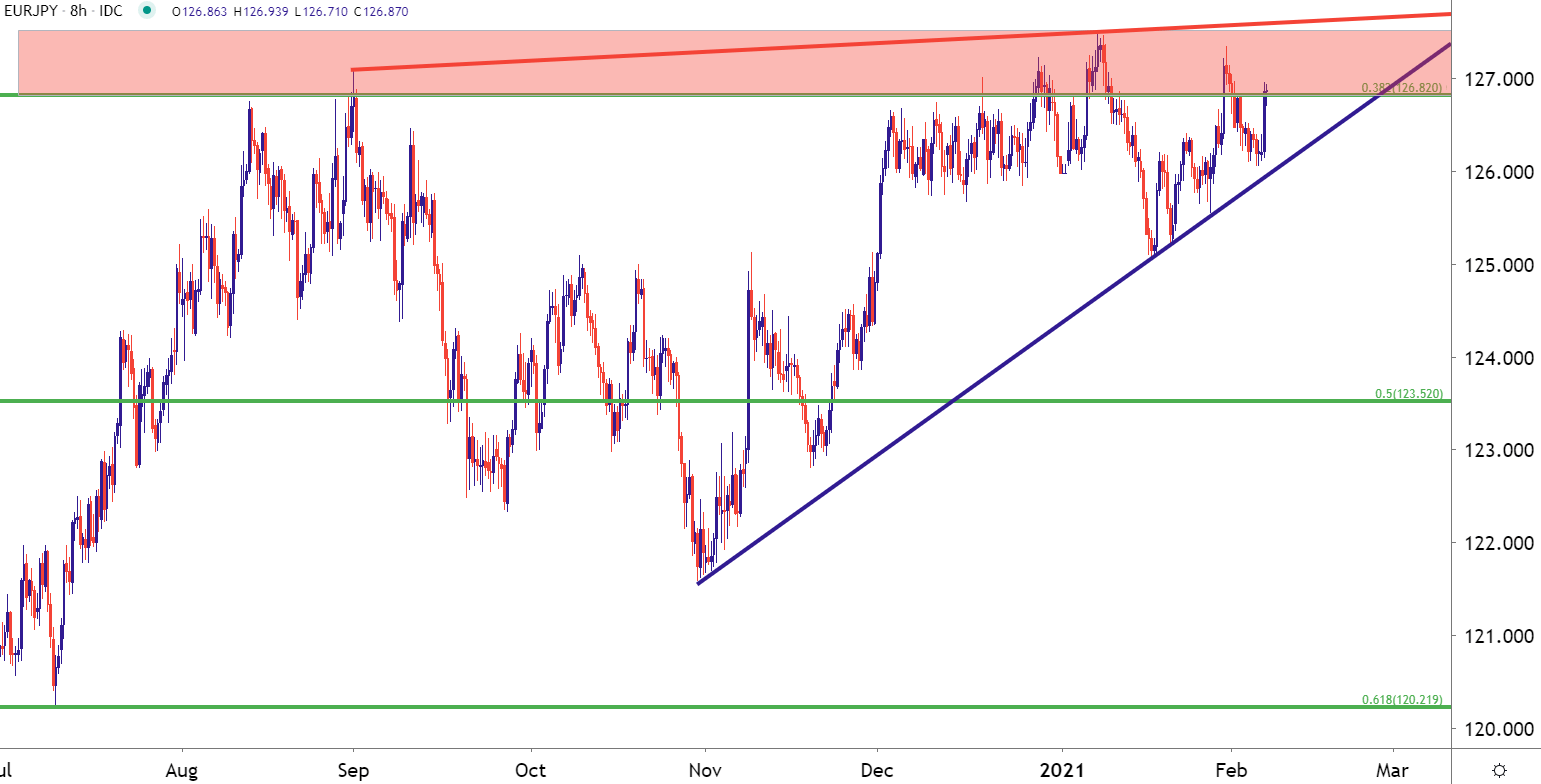
Chart prepared by James Stanley; EURJPY on Tradingview
On the bullish side, if one wanted to be perhaps a bit more dismissive of those barely higher-highs peeking above resistance and, instead, assimilate that batch of resistance as more of a ‘zone,’ then the argument can be made for an ascending triangle pattern, which will often be approached with the aim of bullish breakouts.
But, additionally, there may be a brewing inverse head and shoulders pattern in here, as well, which is also often approached with the aim of bullish breakouts.
To learn more about the inverse head and shoulders pattern, or the ascending triangle pattern, check out DailyFX Education
EUR/JPY Daily Price Chart

Chart prepared by James Stanley; EURJPY on Tradingview
EUR/GBP Sinks into Key Support
In EUR/GBP sellers have been in-control for much of the New Year, driving price action down to a fresh eight-month low last week. But, this is when a key support level came into play that helped to stop the bleeding, at least for now. That support level comes from the 61.8% retracement of the 2019-2020 move in the pair, and despite its success in being able to stall the downtrend at this point, there’s little evidence to suggest that this is anything but a speed bump, and the door may remain open on the short side of the pair.
EUR/GBP Daily Price Chart
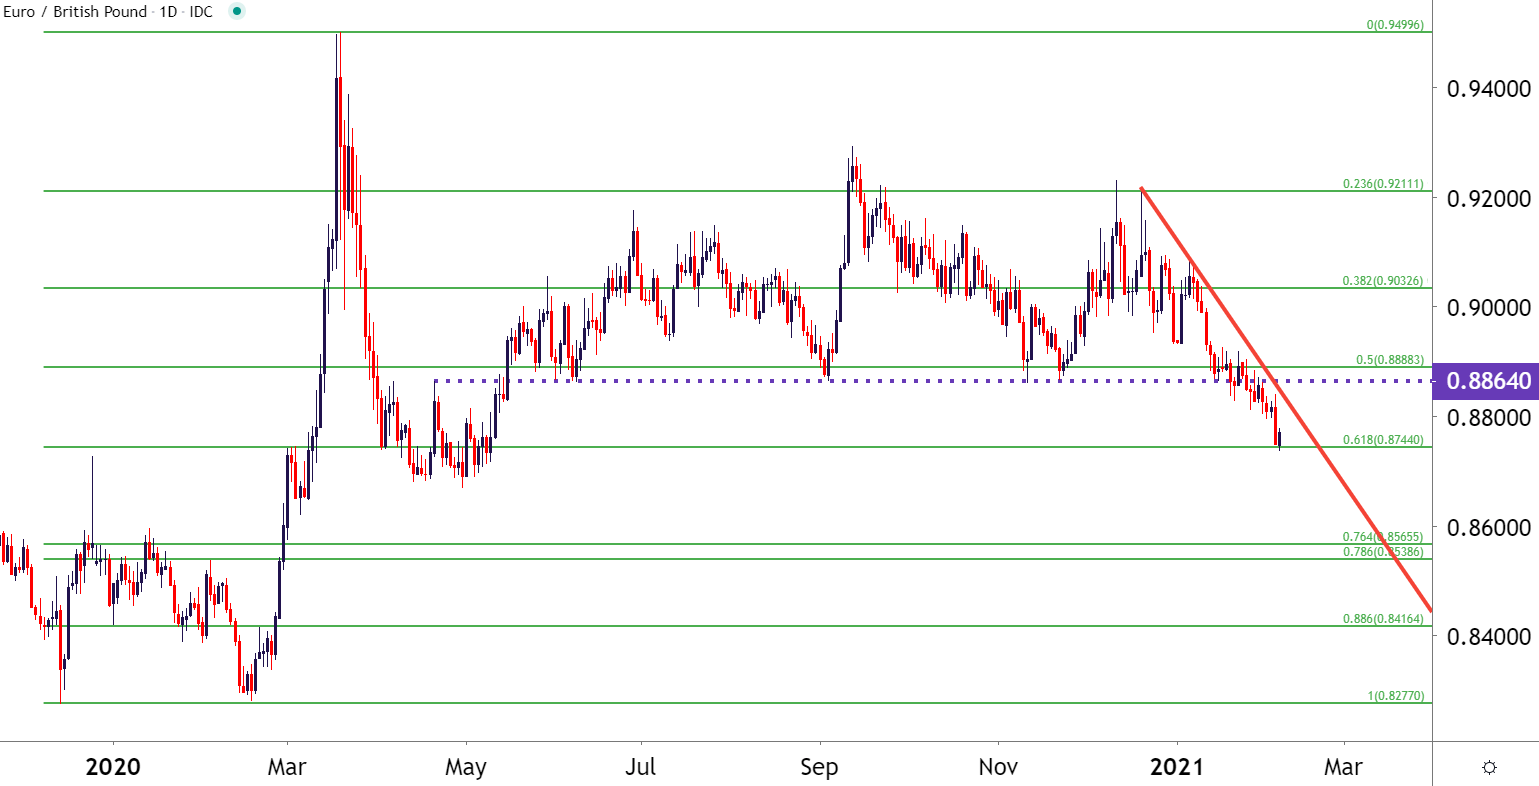
Chart prepared by James Stanley; EURGBP on Tradingview
EUR/CAD Runs From Trendline Resistance
I had written an article around the Canadian Dollar earlier this week and EUR/CAD was one of the pairs looked at. EUR/CAD had put in a resistance inflection on the underside of a prior support trendline; and after that sellers took control for the first four days of this week. But, similar to the Euro pairs looked at above, Friday was a brief reprieve as each of those sell-offs have bounced, EUR/CAD included.
In EUR/CAD, current support appears to be showing from the 38.2% Fibonacci retracement of the 2020 major move. Resistance potential remains around the 1.5455-1.5500 area on the chart; and a breach below the 1.5269 low keeps the door open for bearish breakdown potential into next week.
For more on drawing trendlines and setting trendlines for support/resistance, check out DailyFX Education
EUR/CAD Daily Price Chart
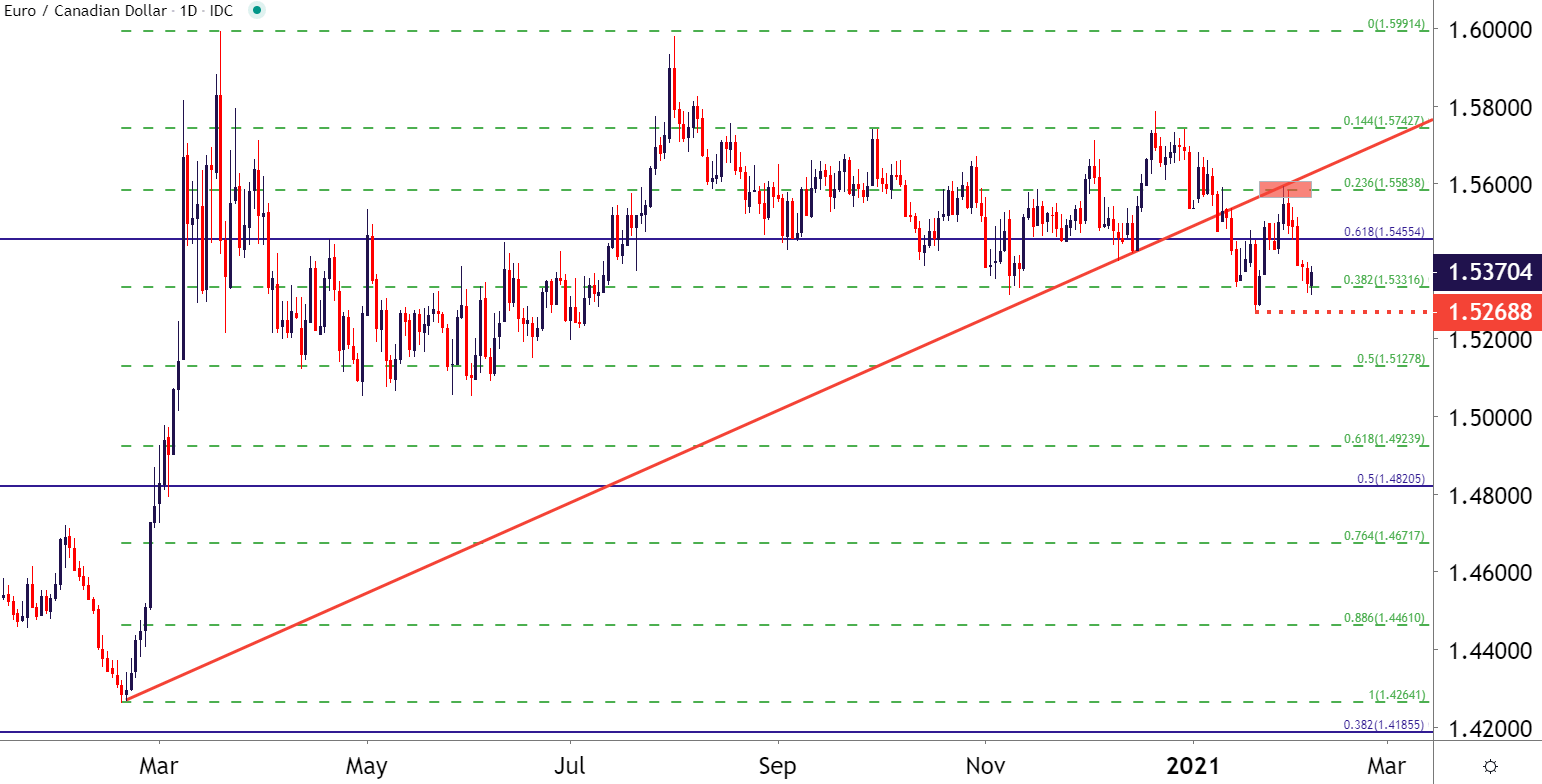
Chart prepared by James Stanley; EURCAD on Tradingview
--- Written by James Stanley, Strategist for DailyFX.com
Contact and follow James on Twitter: @JStanleyFX