US Dollar Technical Price Outlook: DXY Weekly Trade Levels
- US Dollar technical trade level update – Weekly Chart
- USD rally extends for a second week to two-month highs
- DXY weekly resistance into 92-handle – constructive while above 89.93
The US Dollar Index surged more than 0.6% this week with the DXY marking a second consecutive weekly advance to trade at 91.15 in US Trade on Friday. Despite the recent rally, the index remains within the confines of the broader June decline and we’re looking for a reaction off key resistance just higher in the days ahead for guidance. These are the updated technical targets and invalidation levels that matter on the US Dollar Index weekly price chart. Review my latest Strategy Webinar for an in-depth breakdown of this DXY technical setup and more.
US Dollar Index Price Chart – DXY Weekly
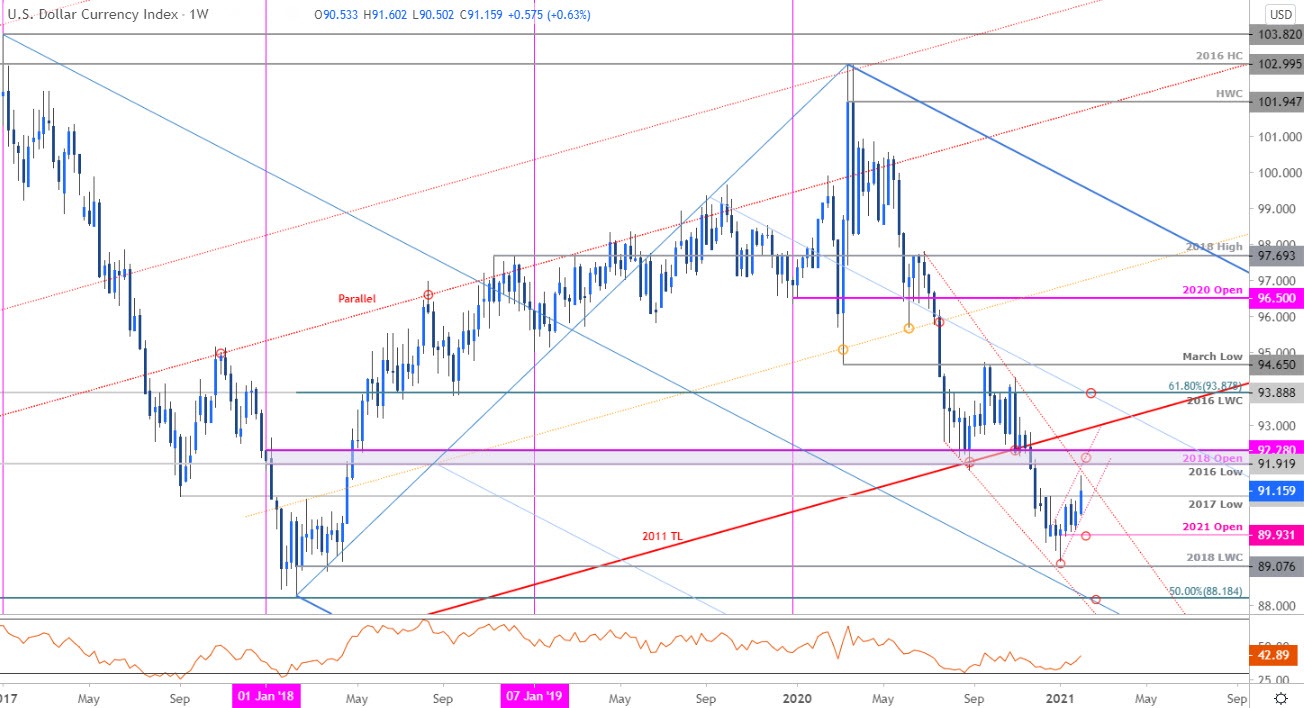
Chart Prepared by Michael Boutros, Technical Strategist; US Dollar Index on Tradingview
Notes: In last month’s US Dollar Weekly Price Outlook we noted that DXY was, “poised to mark the first consecutive weekly rally since September after rebounding just ahead of confluence downtrend support.. pullbacks should be limited by objective yearly open support at 89.93IF price is indeed heading higher.” The index registered a low at 90.04 the following week before rebounding with the recovery stretching to two-month highs into the February open.
The rally has surpassed the 2017 lows at 91.01 with the breakout approaching the first resistance objectives at the June / November trendline backed by the 91.92-92.28- look for a larger reaction there IF reached with a breach / close above needed to suggest a more significant low is in place. Monthly open support rests at 90.53 with bullish invalidation now raised to the objective yearly open at 89.93- a close below this threshold would mark resumption of the broader downtrend.
For a complete breakdown of Michael’s trading strategy, review his Foundations of Technical Analysis series on Building a Trading Strategy
Bottom line: The US Dollar breakout is now approaching initial resistance objectives at the upper bounds of the longer-term downtrend- the immediate advance may be vulnerable into this zone. From a trading standpoint, a good region to reduce long-exposure / raise protective stops- look for downside exhaustion ahead of the 2020 open at 89.93 IF price is indeed heading higher with close above 92.28 needed to suggest a more significant trend reversal is underway. Stay nimble as the index continues to carve the monthly opening-range with a breakout in the weeks ahead likely to offer further guidance on our near-term directional bias.

Key US Data Releases
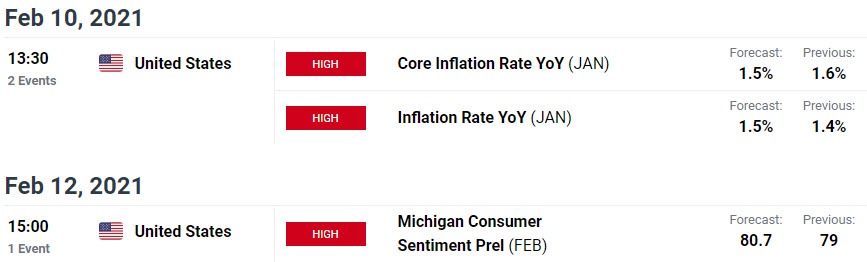
Economic Calendar - latest economic developments and upcoming event risk.
Previous Weekly Technical Charts
- Japanese Yen (USD/JPY)
- Crude Oil (WTI)
- Gold (XAU/USD)
- Australian Dollar (AUD/USD)
- Canadian Dollar (USD/CAD)
- Sterling (GBP/USD)
- Euro (EUR/USD)
--- Written by Michael Boutros, Technical Strategist with DailyFX
Follow Michael on Twitter @MBForex