


Nasdaq 100, S&P 500, FTSE 100 Forecasts: Bullish
- The Nasdaq 100 and S&P 500 trade at record levels with minimal resistance overhead
- The FTSE 100 will look to continue its recovery effort as it negotiates nearby resistance
- Difference between Dow, Nasdaq, and S&P 500: Major Facts & Opportunities
- {{AD}}
Nasdaq 100 Technical Forecast
Outlook: Bullish
Risk appetite remains strong in the market despite calls by many investors that valuations have become unhinged from reality. While some metrics are indeed running above their historical averages, the market can stay irrational longer than one can stay solvent and attempting to call the top at each tick higher may be a fool’s errand. Risk appetite is evidenced elsewhere as US corporations wade into the cryptocurrency space with company’s like Tesla announcing positions in Bitcoin - which also trades at record levels.
Evidently, the market is awash with liquidity and investors are clamoring for returns anywhere they can be found – two potentially ominous signs for US equities. Still, a material pullback in price would require a catalyst and, as it stands, the fundamental landscape remains relatively stable and constructive.
Nasdaq 100 Price Chart: 4 - Hour Time Frame (October 2020 – February 2021)
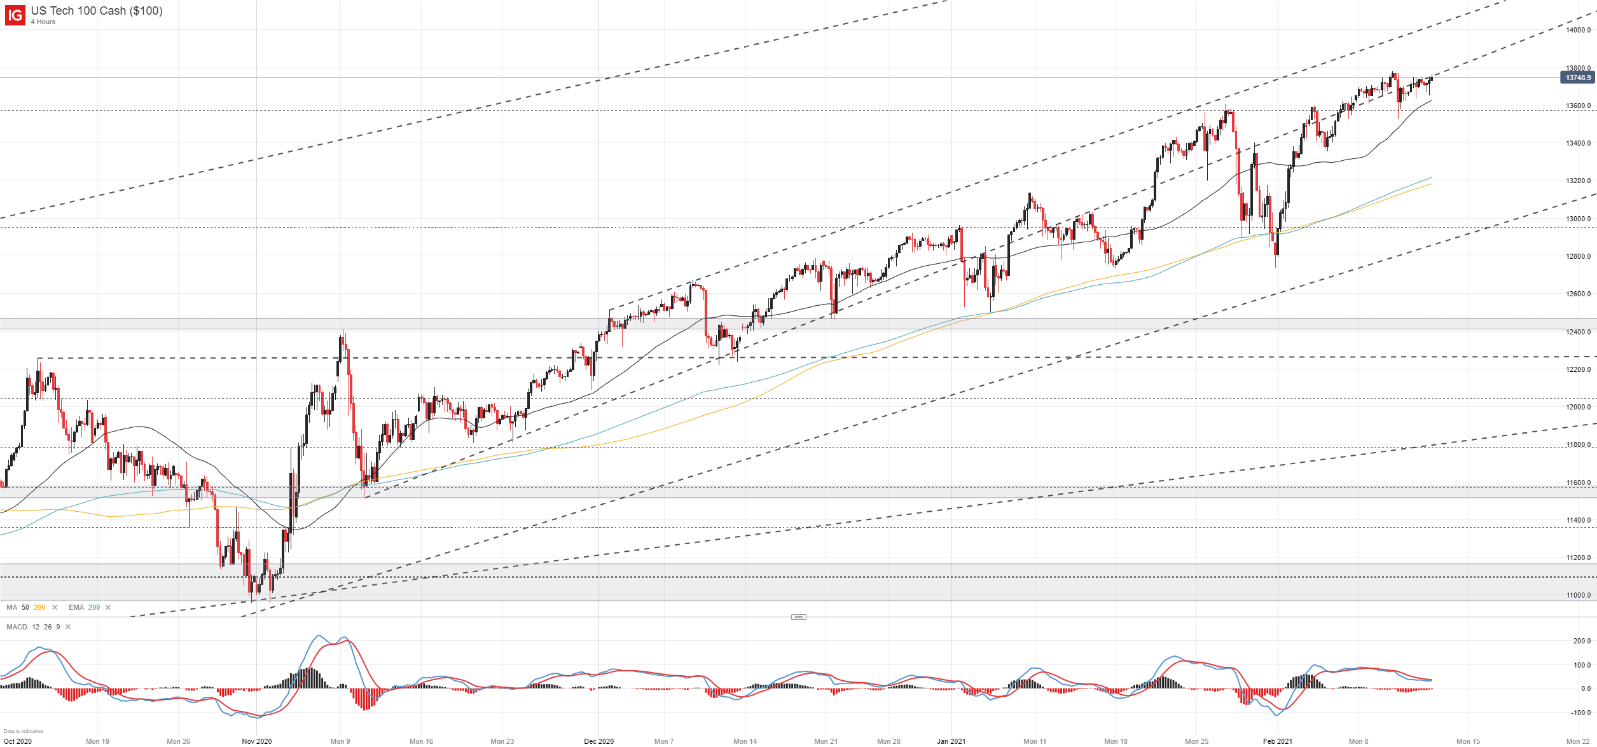
Suffice it to say, the Nasdaq 100 may be poised to climb higher in the weeks ahead. A series of ascending trendlines have offered influence at various stages, but the common theme throughout is their bullish nature. As the tech-heavy index may continue to bounce between the lines on an intraday basis, opportunities for traders utilizing shorter range-trading strategies might arise. Initial support in the event of a bearish reversal may reside in the 13,600 area.

S&P 500 Technical Forecast
Outlook: Bullish
Price action in the S&P 500 is similarly encouraging as the index trades along the underside of an ascending trendline from early November – notching new record highs with every step higher. Since prior price action is nonexistent at these levels, resistance is often derived from trendline projections which results in a lack of hardline technical barriers. Still, recent moves suggest the ascending trendline from November offers some degree of resistance.
S&P 500 Price Chart: Daily Time Frame (February 2020 – February 2021)

Pullbacks may serve as healthy consolidation as the series of higher-highs and higher-lows looks poised to continue. In the meantime, follow @PeterHanksFX on Twitter for updates and analysis.
FTSE 100 Technical Forecast
Outlook: Bullish
The FTSE 100 lags behind the Nasdaq 100 and S&P 500, but a series of ascending trendlines may help guide the FTSE higher in the weeks to come. Thankfully for bulls, a plethora of support resides slightly beneath the current trading price while initial resistance might reside along the 200-period moving average near 6,625.
FTSE 100 Price Chart: 4 - Hour Time Frame (July 2020 – February 2021)

A key risk to the rally at this stage is a reversal beneath the January low. Such a break would establish a series of lower-lows and lower-highs, signaling the FTSE 100 may be vulnerable to a longer-term contraction.
--Written by Peter Hanks, Strategist for DailyFX.com


