
Weekly Technical Gold Price Forecast: Neutral
- Gold prices continue to struggle, even as the US Dollar falls back. Risk appetite is surging, reducing demand for the safe haven.
- China’s Spring Festival Golden Week is under way, meaning that global financial markets may see less trading activity coming out of Asia in the coming days.
- The IG Client Sentiment Index suggests that gold prices in USD-terms (XAU/USD) have a mixed bias.
Gold Prices Week in Review
Gold prices rebounded last week, but only if you squint. Both gold in NZD-terms (XAU/NZD, +0.14%) and gold in USD-terms (XAU/USD, +0.56%) rallied, but every other major currency denomination of gold prices fell back. In a sense, the gains seen by either XAU/NZD or XAU/USD proved inconsequential, insofar as key technical breakdowns that preceded this past week’s price action have not been nullified. Gold in EUR-terms (XAU/EUR, -0.04%) and gold in GBP-terms (XAU/GBP, -0.32%) remain two of the more interesting gold-crosses moving forward, given how those currencies are faring against the US Dollar (via the DXY Index).

Top Economic Events in Week Ahead
The third week of February offers a mixed economic calendar, with a more global focus (and less so on the United States, politically or economically, with a federal holiday on Monday, shuttering markets). But with China’s Spring Festival Golden Week having commenced with the Chinese New Year on Friday, February 12, trading activity out of Asia may be muted over the coming days. In fact, economic data flow from the world’s second largest economic is null this week.
- On Tuesday, the second 4Q’20 Euroarea GDP report (gold in EUR-terms, XAU/EUR) is due.
- On Wednesday, the January UK inflation report (CPI) (gold in GBP-terms, XAU/GBP), the January Canada inflation report (CPI) (gold in CAD-terms, XAU/CAD), the January US retail sales report (gold in USD-terms, XAU/USD), and the January FOMC meeting minutes (gold in USD-terms, XAU/USD) are scheduled to be released.
- On Thursday, the January Australia jobs report (gold in AUD-terms, XAU/AUD) and the January Japan inflation report (CPI) (gold in JPY-terms, XAU/JPY) are due.
- On Friday, the February US Markit Manufacturing PMI Flash (gold in USD-terms, XAU/USD) will be released.
Gold Prices and Volatility Relationship Tightening
Historically, gold prices have a relationship with volatility unlike other asset classes. While other asset classes like bonds and stocks don’t like increased volatility – signaling greater uncertainty around cash flows, dividends, coupon payments, etc. – gold tends to benefit during periods of higher volatility.
GVZ (Gold Volatility) Technical Analysis: Daily Price Chart (February 2020 to February 2021) (Chart 1)
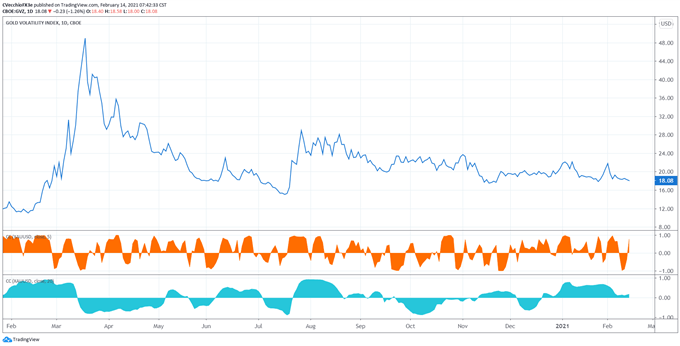
Gold volatility has fallen in recent days, but gold prices have otherwise rallied. Gold volatility (as measured by the Cboe’s gold volatility ETF, GVZ, which tracks the 1-month implied volatility of gold as derived from the GLD option chain) is trading at 18.08, well-off the yearly high set last week at 24.03. The 5-day correlation between GVZ and gold prices is +0.78 while the 20-day correlation is +0.19; one week ago, on February 5, the 5-day correlation was +0.65 and the 20-day correlation was +0.12.
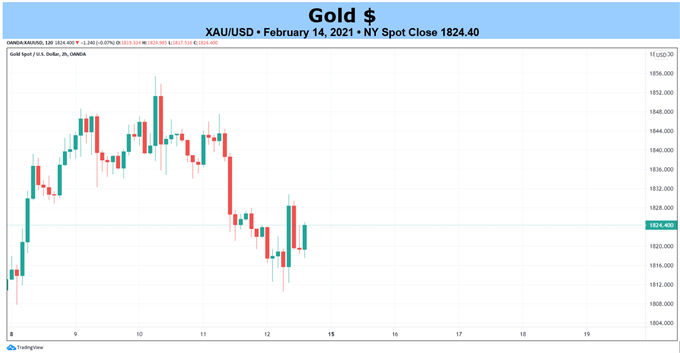
Gold Price Rate Technical Analysis: Daily Chart (February 2020 to February 2021) (Chart 2)
Gold prices are lingering around a familiar area, the 23.6% Fibonacci retracement of the 2015 low/2020 high range at 1832.48, as well as the 38.2% Fibonacci retracement of the 2020 low/high range at 1836.97. But this time is different than the last visit at the end of January: instead of support, this area is now resistance. But gold prices remain below rising trendline from the March and November 2020 lows, having failed once again to retake said uptrend mid-week. Gold prices are again below their daily 5-, 8-, 13-, and 21-EMA envelope, which is still in bearish sequential order. Daily MACD’s drop in bearish territory is resuming, and daily Slow Stochastics are turning lower ahead of their median line. It’s make or break time for gold prices.
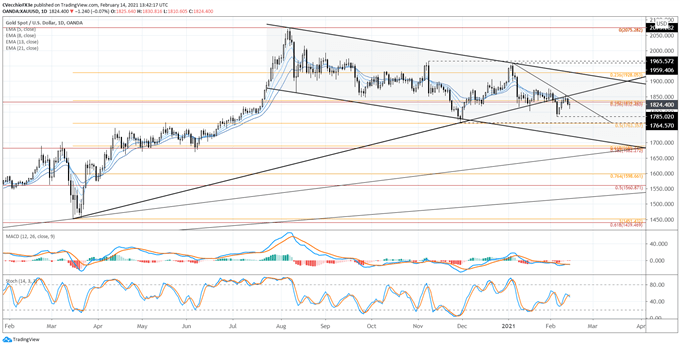
Gold Price Technical Analysis: Weekly Chart (October 2015 to February 2021) (Chart 3)
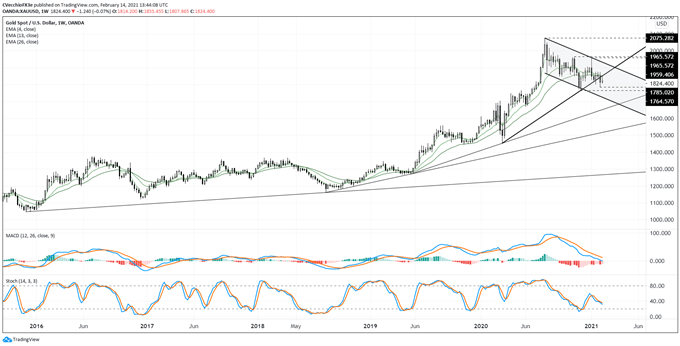
In prior outlooks it has been noted that “breaking the downtrend from the August and November 2020 highs as well as the 38.2% Fibonacci retracement from the 2020 high/low range suggests that the next leg higher is beginning. A move higher through 1965.57 would suggest that the series of weekly ‘lower highs and lower lows’ has ended. A drop below 1840…would suggest that the uptrend from the March and November 2020 low has been broken, suggesting a deeper setback towards 1764.57 (November 2020 low) would be possible.” This setback occurred, but now the fight to get back above the pandemic uptrend will very likely determine the next directional bias.
Technically speaking, further downside from here would warrant a reconsideration the 1Q’21 forecast, which suggests that gold prices could hit new highs this quarter.

Don't Forget the Long-term Fundamentals
The longer-term fiscal stimulus impulse in the context of a low interest rate environment should be beneficial for gold prices (akin to the 2009-2011 period) – it’s that simple from my point of view. With US President Joe Biden pushing for his full $1.9 trillion fiscal stimulus package, and Senate Democrats having the ability to pass significant portions of his plan into law vis-à-vis budget reconciliation, the fiscal impulse that helped gold prices in 2020 may soon return in 2021.
GOLD PRICE VERSUS COT NET NON-COMMERCIAL POSITIONING: DAILY TIMEFRAME (February 2020 to February 2021) (CHART 4)
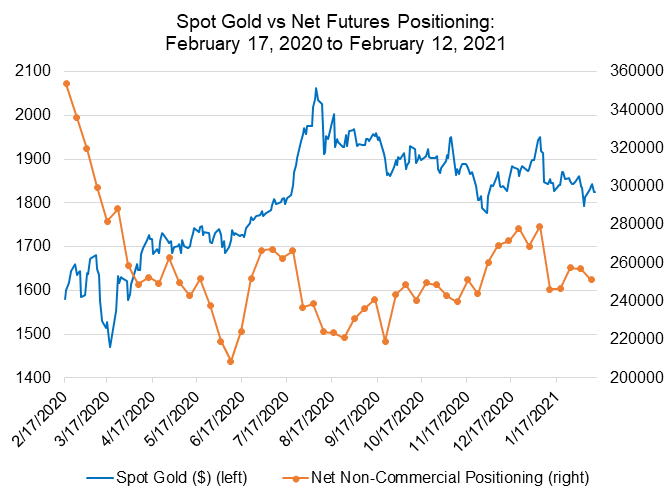
Next, a look at positioning in the futures market. According to the CFTC’s COT data, for the week ended February 9, speculators decreased their net-long gold futures positions to 251.4K contracts, down from the 257.1K net-long contracts held in the week ended February 2. As noted in a weekly gold price forecast near the start of 2021, “further liquidation of net-long contracts would likely continue to drive down the price of gold, though it remains to be seen if traders are willing to hold fewer long gold contracts in 2021 than they did at their lowest point in 2020 (208.8K contracts for the week ended June 9).”
IG CLIENT SENTIMENT INDEX: GOLD PRICE FORECAST (February 14, 2021) (CHART 5)
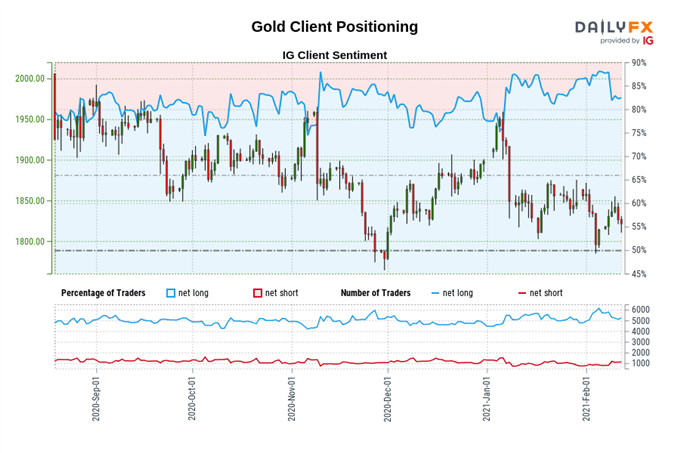
Gold: Retail trader data shows 82.76% of traders are net-long with the ratio of traders long to short at 4.80 to 1. The number of traders net-long is 1.08% higher than yesterday and 10.74% lower from last week, while the number of traders net-short is 7.67% lower than yesterday and 21.02% higher from last week.
We typically take a contrarian view to crowd sentiment, and the fact traders are net-long suggests Gold prices may continue to fall.
Positioning is more net-long than yesterday but less net-long from last week. The combination of current sentiment and recent changes gives us a further mixed Gold trading bias.
--- Written by Christopher Vecchio, CFA, Senior Currency Strategist