

Nasdaq 100 index Technical Forecast: Bearish
- The Nasdaq 100 index hit an all-time high of 13,879 before entering into a minor correction
- Prices remain within an “Ascending Channel”, with 20-Day SMA serving as an immediate support
- The MACD indicator has formed a bearish crossover, suggesting that momentum has turned bearish

The Nasdaq 100 index reached its all-time high of 13,879 on February 16th before entering a consolidative period. The formation of two long bearish candlesticks however hint at strong selling pressure as prices failed to break a key resistance level of 13,865 – the 161.8% Fibonacci extension. The index appeared to be overstretched after surging nearly 26% from early November to mid-February, rendering it vulnerable to a technical pullback when profit-taking activities kick in.
An immediate support level can be found at the 20-Day Simple Moving Average line (13,530). Breaking below this level may lead to further losses with an eye on 13,362, where the 127.2% Fibonacci extension and the lower bound of the “Ascending Channel” intercept. An even deeper pullback below 13,362 may hint at a near-term trend reversal and thus open the door for further downside potential towards the 50-Day SMA line (13,190) for support.
The overall trend remains bullish-biased, as suggested by upward-sloped moving averages as well as the “Ascending Channel”. Near-term momentum appears biased towards the downside after the formation of a bearish MACD crossover however.
Nasdaq 100 Index – Daily Chart
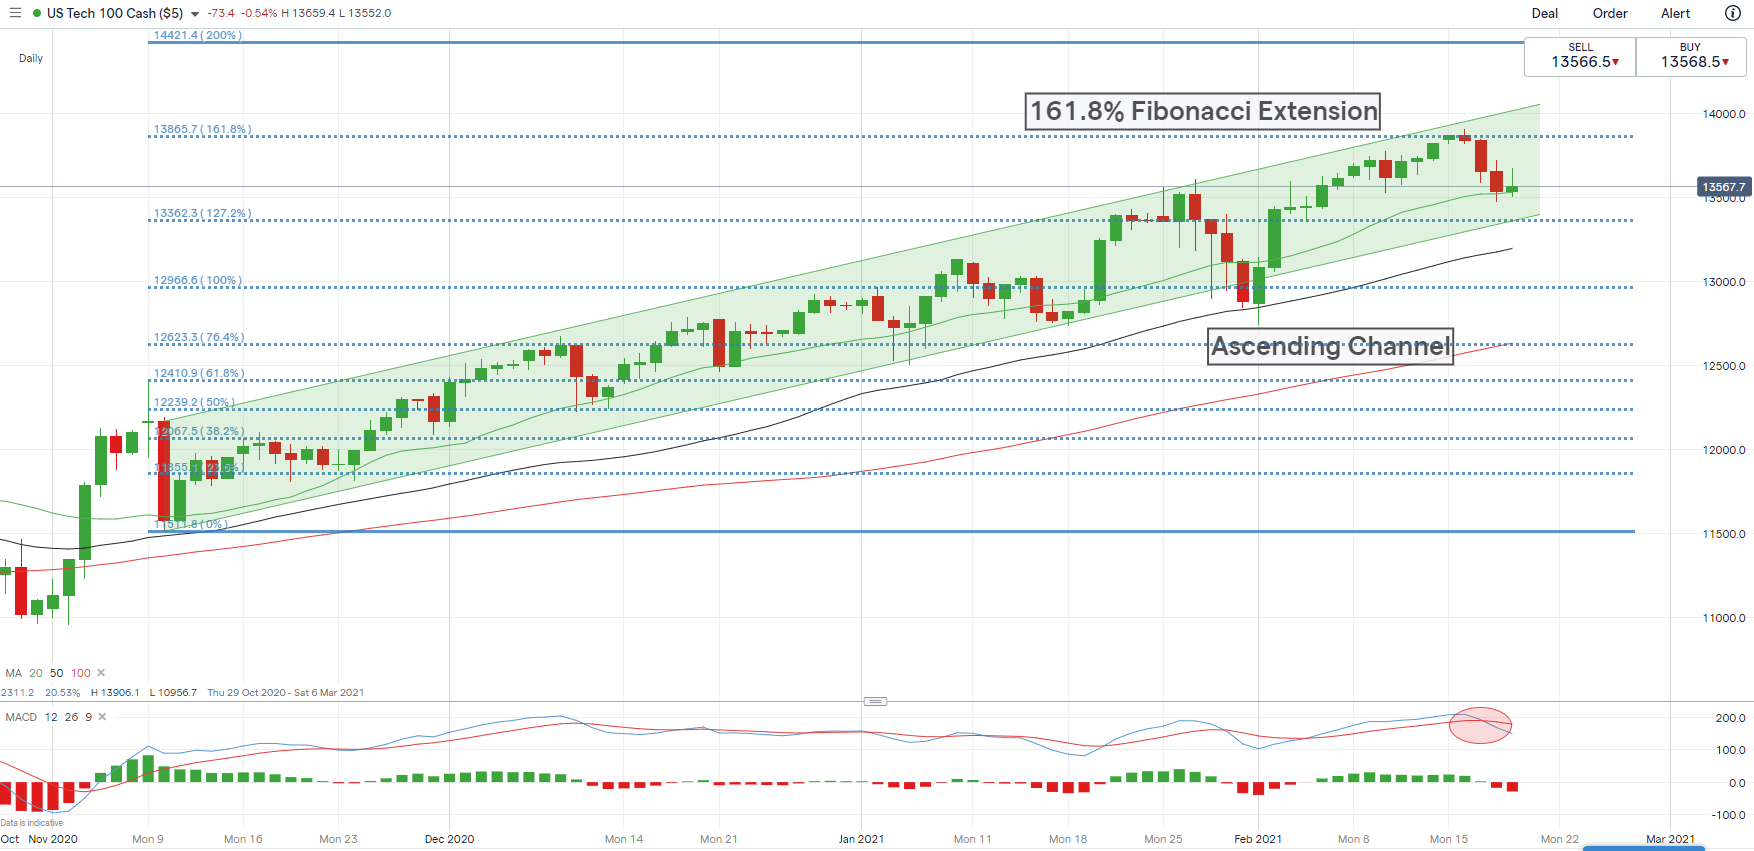
Chart by IG
On the weekly basis, the Nasdaq 100 index pocketed an astonishing gain of 107% from late March 2020 until early February 2021(chart below). The overall trend remains bullish-biased, with recent consolidation potentially paving the way for higher highs towards the 200% Fibonacci extension level (14,400). Prices are well supported by 4-, 10- and 20-period SMA lines, suggesting that the medium-term bull trend remains intact.
Nasdaq 100 Index – Weekly Chart


--- Written by Margaret Yang, Strategist for DailyFX.com
To contact Margaret, use the Comments section below or @margaretyjy on Twitter