US Dollar Technical Price Outlook: DXY Weekly Trade Levels
- US Dollar technical trade level update – Weekly Chart
- USD holding below technical confluence barrier – Bulls face make-or-break resistance
- DXY weekly resistance steady at 92.28 – constructive while above 89.93
The US Dollar Index higher this week with the DXY rallying 0.37% to trade at 92.02 in early New York trade on Friday. The advance comes amid a volatile week for the greenback with the initial FOMC sell-off reversing sharply into the close of the week. Despite a range of nearly 1%, the index remains just below a critical technical resistance barrier we’ve been tracking for months and the focus remains on possible inflection off this zone for guidance. These are the updated technical targets and invalidation levels that matter on the US Dollar Index price chart heading into next week. Review my latest Strategy Webinar for an in-depth breakdown of this DXY technical setup and more.
US Dollar Index Price Chart – DXY Weekly

Chart Prepared by Michael Boutros, Technical Strategist; US Dollar Index on Tradingview
Notes: In my last US Dollar Weekly Price Outlook we noted that the DXY breakout was faltering, “at the 92.28 resistance zone- the advance may be vulnerable while below this threshold.” The Index plunged 1.3% off the highs into the FOMC rate decision this week before reversing sharply higher with the DXY now once again testing this major technical zone.
Weekly resistance unchanged at the 100% extension / the 2018 yearly open / August low close at 92.08/30–a breach / close above this zone is needed to keep the long-bias viable towards the highlighted trendline confluence near ~93.20s- area of interest for possible topside exhaustion IF reached. Initial support steady at the 2017 swing low at 91.01 with broader bullish invalidation at the objective yearly open at 89.93.
For a complete breakdown of Michael’s trading strategy, review his Foundations of Technical Analysis series on Building a Trading Strategy
Bottom line: The US Dollar was undeterred by this week’s Fed decision and the index remains poised just below lateral resistance. From a trading standpoint, the focus remains on possible inflection off this key zone with a breach needed to keep the immediate long-bias viable- look for downside exhaustion ahead of this week’s low IF price is indeed heading higher on this stretch. Keep in mind we get some key US data releasees next week with the Core Personal Consumption Expenditure (PCE – the Fed’s preferred inflationary gauge) of particular interest into the close of the week.

Key US Data Releases
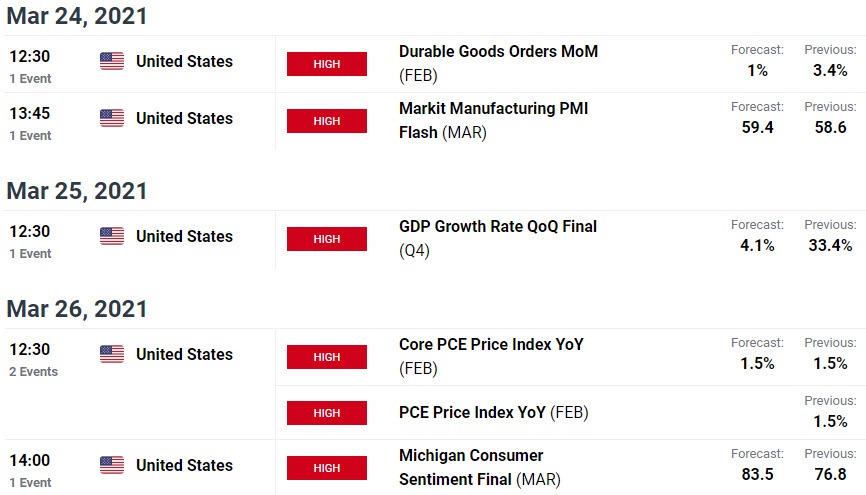
Economic Calendar - latest economic developments and upcoming event risk.
Previous Weekly Technical Charts
--- Written by Michael Boutros, Technical Strategist with DailyFX
Follow Michael on Twitter @MBForex