US Dollar Technical Price Outlook: DXY Weekly Trade Levels
- US Dollar technical trade level update – Weekly Chart
- USD reverses sharply of confluent uptrend resistance- correction underway
- DXY weekly resistance steady at 92.28, 93 – constructive while above 90.82
The US Dollar Index plummeted for the second consecutive week with DXY down more than 0.7% in early New York trade on Friday. The losses come on the heels of a larger reversal from confluent uptrend resistance and while the threat for a deeper pullback remains, the bears may be vulnerable in the days ahead as the index approaches yearly uptrend support just lower. These are the updated technical targets and invalidation levels that matter on the US Dollar Index price chart heading into next week. Review my latest Strategy Webinar for an in-depth breakdown of this DXY technical setup and more.
US Dollar Index Price Chart – DXY Weekly
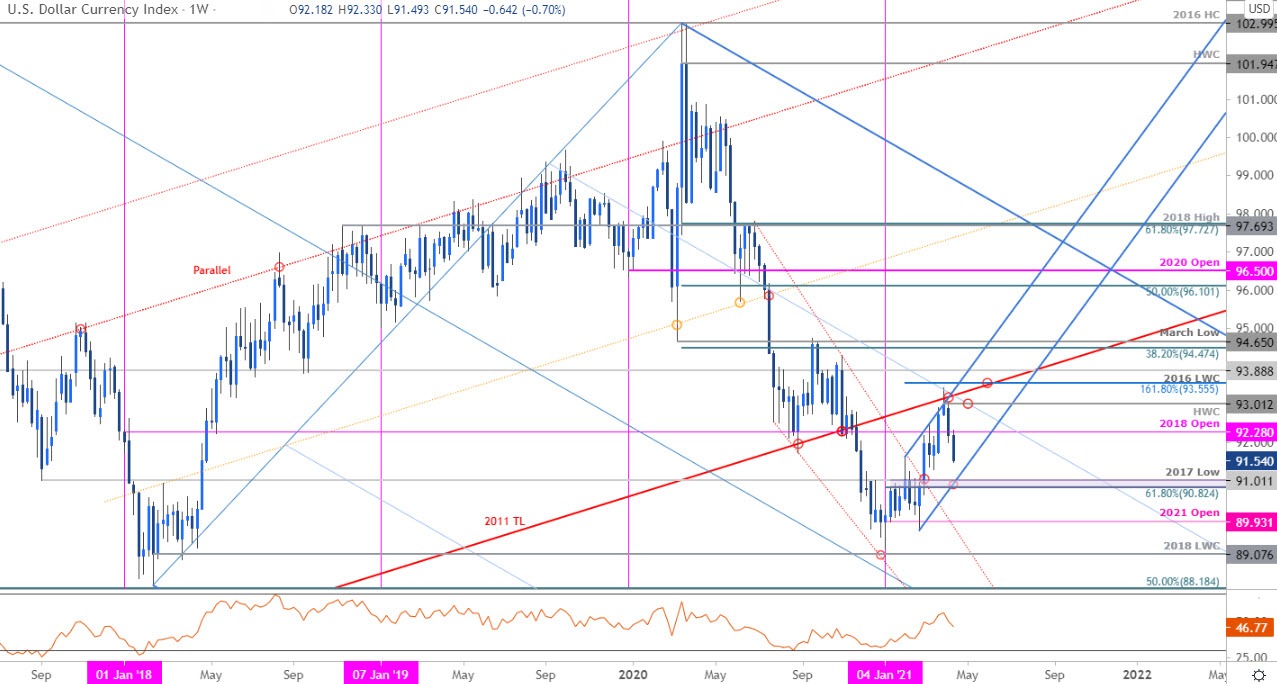
Chart Prepared by Michael Boutros, Technical Strategist; US Dollar Index on Tradingview
Notes: In my last US Dollar Weekly Price Outlook we noted that DXY was testing resistance near the 2018 yearly-open at 92.28 with a topside breach exposing, “the highlighted trendline confluence near ~93.20s- area of interest for possible topside exhaustion IF reached.” Price registered an intraday high at 93.43 into the close of March before reversing sharply lower with the decline now extending for a second consecutive week.
Initial support rests with the 2017 low-day close / mid-March swing low around 94.40s with key weekly support at 90.82–91.01 – a region defined by the 61.8% retracement of the yearly range and the 2017 swing low. A break / close below this threshold would be needed to suggest a more significant high was registered last month with such a scenario exposing the objective yearly open at 89.93. Initial resistance now back at 92.28 and the high-week close at 93.01. Ultimately a breach / close above the 1.618% extension / 2016 low-week close at 93.55/88 would be needed to mark resumption of the yearly USD uptrend.
For a complete breakdown of Michael’s trading strategy, review his Foundations of Technical Analysis series on Building a Trading Strategy
Bottom line: The US Dollar is in correction within the yearly uptrend with the decline now eyeing initial support objectives just lower. From a trading standpoint, look to reduce short-exposure / lower protective stops on a stretch towards the 91-handle – an area of interest for possible downside exhaustion IF reached.
Ultimately a deeper pullback here may offer more favorable opportunities closer to trend support with a breach above the 93 needed to alleviate further downside pressure. Review my latest US Dollar Price Outlook for a closer look at the near-term technical DXY trading levels.

Key US Data Releases

Economic Calendar - latest economic developments and upcoming event risk.
Previous Weekly Technical Charts
- Gold (XAU/USD)
- Australian Dollar (AUD/USD)
- Sterling (GBP/USD)
- Japanese Yen (USD/JPY)
- New Zealand Dollar (NZD/USD)
- Canadian Dollar (USD/CAD)
--- Written by Michael Boutros, Technical Strategist with DailyFX
Follow Michael on Twitter @MBForex