Gold Price Analysis and News
- Where Real Yields Go, So Will Gold
- Gold Levels to Watch
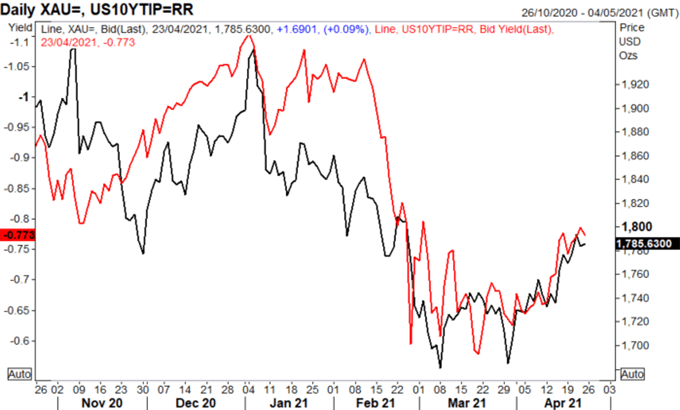
WHERE REAL YIELDS GO, SO WILL GOLD
Gold is on course for a third consecutive weekly rise, which marks the first occasion since December. Keep in mind that this has come at a time where US yields have pulled back from its recent highs, settling into a new range, while real yields have also been on the slide again, while a softer USD has also helped matters for the precious metal. Perhaps the market is now understanding the Fed’s message that they will not alter their stance on monetary policy in light of strong US data, which has been expected. That being said, I believe the main showdown will come in June, when the Federal Reserve update its economic projections, in particular the dot plot. But for now, where real yields go, so will gold.
| Change in | Longs | Shorts | OI |
| Daily | -9% | 1% | -4% |
| Weekly | -12% | 18% | 1% |
Gold vs US Yields

Source: Refinitiv
HURDLES REMAIN FOR FURTHER UPSIDE
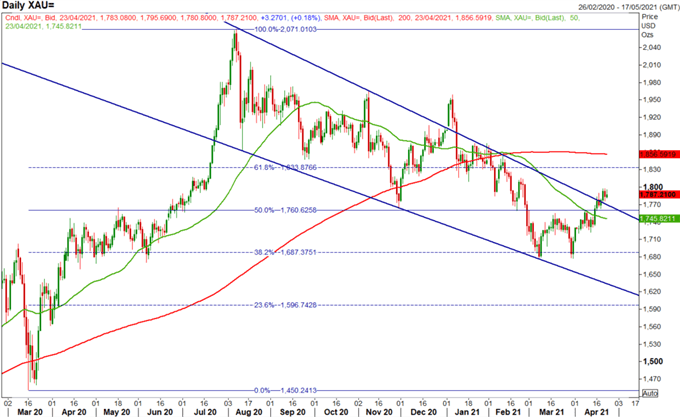
For quite some time I had highlighted the importance of breaking the key 1760-65 area. Now that the precious metal is above, it does raise the question as to whether now is the time to be bullish on gold. In the short run, it has brightened the outlook, confirming the recent double bottom, however, hurdles remain for gold with the psychological 1800 level and 1833 (61.8% Fibonacci retracement) ahead. That said, prior resistance now support is at 1760-65 and should the precious metal close below 1745 (50DMA) a move to 1700 looks to be back on the cards.
Gold Chart: Daily Time Frame

Source: Refinitiv


