

Australian Dollar, AUD/USD, AUD/JPY, AUD/CAD, GBP/AUD – Weekly Technical Outlook
- Australian Dollar mostly weakened this past week, more to come?
- AUD/USD cleared support zone, AUD/JPY still contending with its
- AUD/CAD eyeing potential bullish signal, GBP/AUD breakout eyed

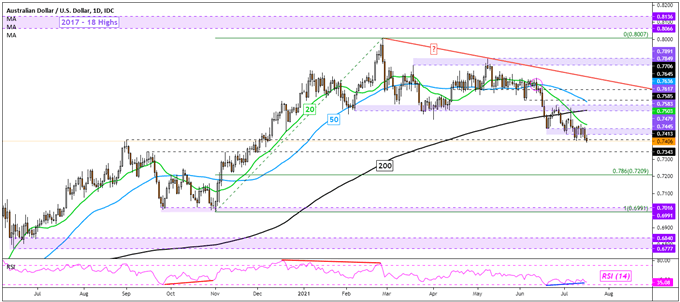
AUD/USD - Bearish
The Australian Dollar extended losses this past week, with AUD/USD taking out the 0.7445 – 0.7479 support zone. This follows a series of bearish crossovers, including one between the 20-day and 50-day Simple Moving Averages (SMAs). Another one occurred between the 20-day and 200-day SMAs. These seem to be favoring a downside technical bias. Still, positive RSI divergence is persisting. This shows that downside momentum is fading, which can at times precede a turn higher.
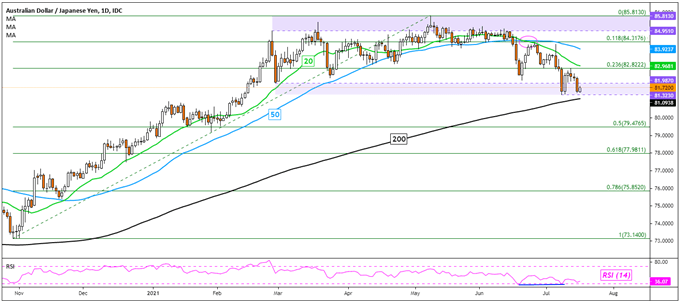
AUD/JPY - Neutral
The Australian Dollar aimed lower against the Japanese Yen, but AUD/JPY remained constrained within the 81.323 – 81.987 support zone. A bearish crossover between the 20-day and 50-day SMAs still offers a near-term downward technical bias. However, the 200-day SMA is just below immediate support and it could reinstate the broader focus to the upside. If not, a drop through it would expose the midpoint of the Fibonacci retracement at 79.476 towards the October low.
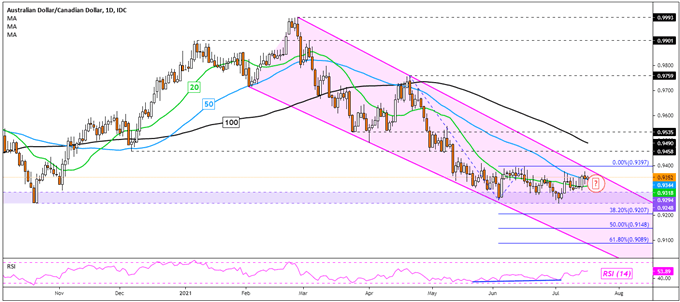
AUD/CAD – Neutral
The Australian Dollar continued to consolidate against the Canadian Dollar this past week, with AUD/CAD idling above the key 0.9248 – 0.9294 support zone. The pair remains in a downtrend, guided lower by a Descending Channel since February. Now, a bullish crossover between the 20-day and 50-day SMAs may occur, opening the door to an upside technical bias. That would subsequently expose the 100-day SMA. Otherwise, clearing support exposes the 38.2% Fibonacci extension at 0.9207.

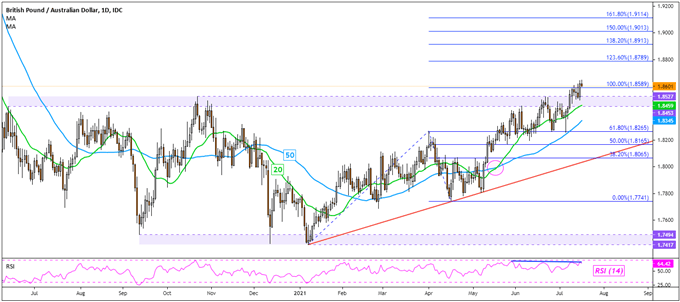
GBP/AUD – Bullish
The British Pound extended gains against the Australian Dollar this past week, with GBP/AUD further confirming the break above the key 1.8453 – 1.8527 resistance zone. This has opened the door to reversing the dominant downtrend that occurred throughout most of last year. The 123.6% Fibonacci extension was exposed at 1.8789. A turn lower may place the focus on the 20-day and 50-day SMAs. Still, negative RSI divergence persists, warning to remain cautious.

--- Written by Daniel Dubrovsky, Strategist for DailyFX.com
To contact Daniel, use the comments section below or @ddubrovskyFX on Twitter