
FTSE 100, DAX Analysis and News
FTSE 100 | Upside Momentum Remains as FTSE Eyes 7200
The FTSE 100 notches another modest gain for the week (+0.4%) and once again the index is eyeing a test of the psychological 7200 with the recent YTD highs only slightly above at 7220. On the whole trading conditions have been rather quiet, and when markets have gotten slightly more interesting, weak data has pushed equities even higher given the current bad news = good news (for stocks) regime. Momentum signals continue to point towards further upside and the RSI is some distance away from signalling overbought, the path of least resistance is higher. While on the downside, pullbacks have been limited to the 50DMA (7095) and the rising trendline from the October 2020 lows.
| Change in | Longs | Shorts | OI |
| Daily | -10% | 8% | 2% |
| Weekly | -39% | 18% | -6% |
FTSE 100 Price Chart: Daily Time Frame
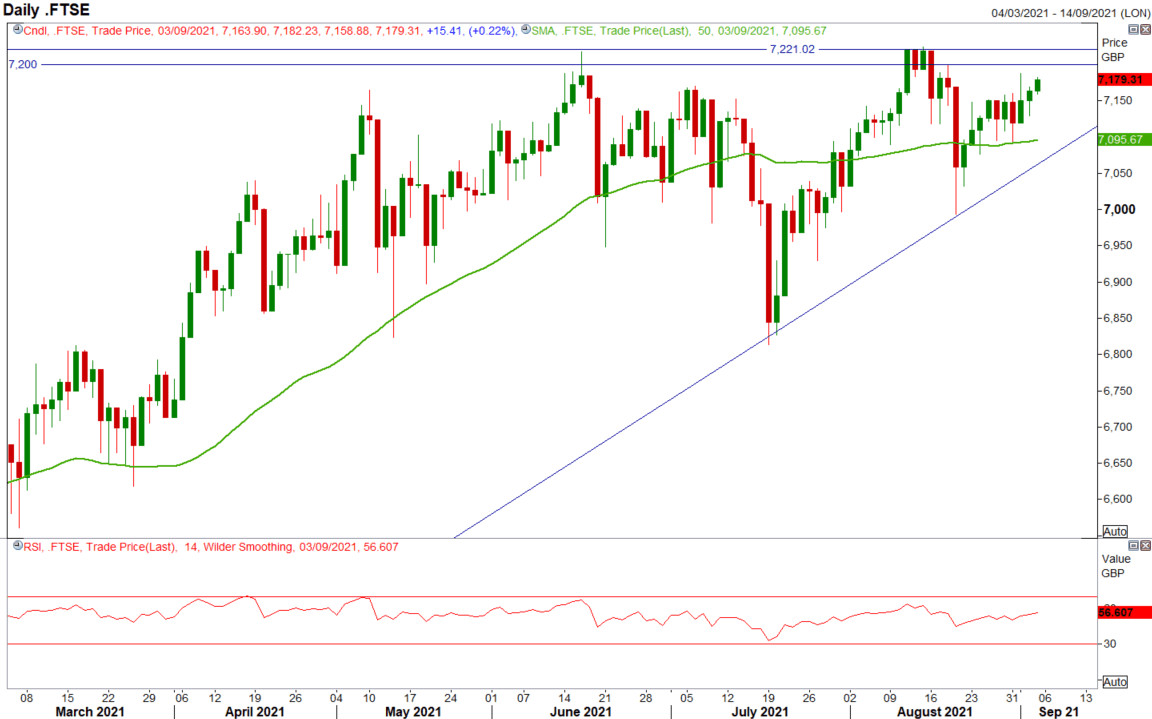
Source: Refinitiv
S&P 500 | Trend is Your Friend
The trend is your friend, a common phrase in financial jargon, but also rings very true for how the S&P 500 has traded in the last few months. Now while questions are being raised as to whether this run can continue with the index already up over 20% this year there are little in the way of narratives shaping up to present a material concern for the index. Taking a look at the technicals, the RSI is showing a slight bearish divergence but with the indicator yet to hit overbought levels, I am doubtful that this will be set up a cause for alarm bells. I suspect the upcoming weak will be another grind higher for the index. On the downside, weakness has been limited to the 50DMA as market participants maintain a buy the dip approach.
| Change in | Longs | Shorts | OI |
| Daily | 4% | 0% | 1% |
| Weekly | 3% | -4% | -2% |
S&P 500 Price Chart: Daily Time Frame

Source: Refinitiv