

S&P 500, Nasdaq 100 Talking Points:
- Treasury yields continue to jump but the S&P 500 appears undeterred as prices produced yet another fresh all-time-high this morning.
- The Nasdaq 100 appears to be trading a bit more cautiously as a lower-high presented itself last week, opening the door for greater pullback potential should this yield move continue to show.
- The analysis contained in article relies on price action and chart formations. To learn more about price action or chart patterns, check out our DailyFX Education section.

One of the cleanest trends since the December FOMC rate decision has been in US rates, particularly at the shorter-end of the curve. That theme has only continued to heat up as the page has turned into calendar year of 2022, and the 10-year Treasury Yield is now approaching a significant spot of resistance at 1.69%, a level that turned-around two advances over the previous three months with tops set on Oct. 22 and Nov. 24).
Beyond that 1.69% marker is the 2021 high that was set in late-Q1 of last year at 1.765%, a clear indication of a market gearing up for a more-hawkish FOMC at some point this year. Perhaps the more surprising fact is that the S&P 500 continues to set new all-time-highs even as this aggressive rise in yields has continued, illustrating a market gearing up for a more-hawkish Fed this year.
10-Year Treasury Yields

Chart prepared by James Stanley; TNX on Tradingview
S&P 500 Resolves Aggressive Range
December trade, particularly through the Christmas holiday, saw some impressive volatility in the S&P 500 as those yields were jumping. After touching up to a fresh all-time-high on December 16th, the index then tanked into the following Monday morning, eventually finding some support around the 4525 spot on the chart. And that has since led to a massive incline bringing on another fresh all-time-high that’s continued through this morning’s trade.
There was a brief range that had built from last Thursday into this morning, just before bulls began to make another push, and from that range traders can gleam some usable levels for near-term strategy in the index.
Prior points of resistance can be re-purposed for potential support, and given the fresh all-time-highs that are printing at the moment, waiting for a pullback coupled with a show of support seems the more prudent way of approaching the matter at the moment.
S&P 500 Hourly Price Chart
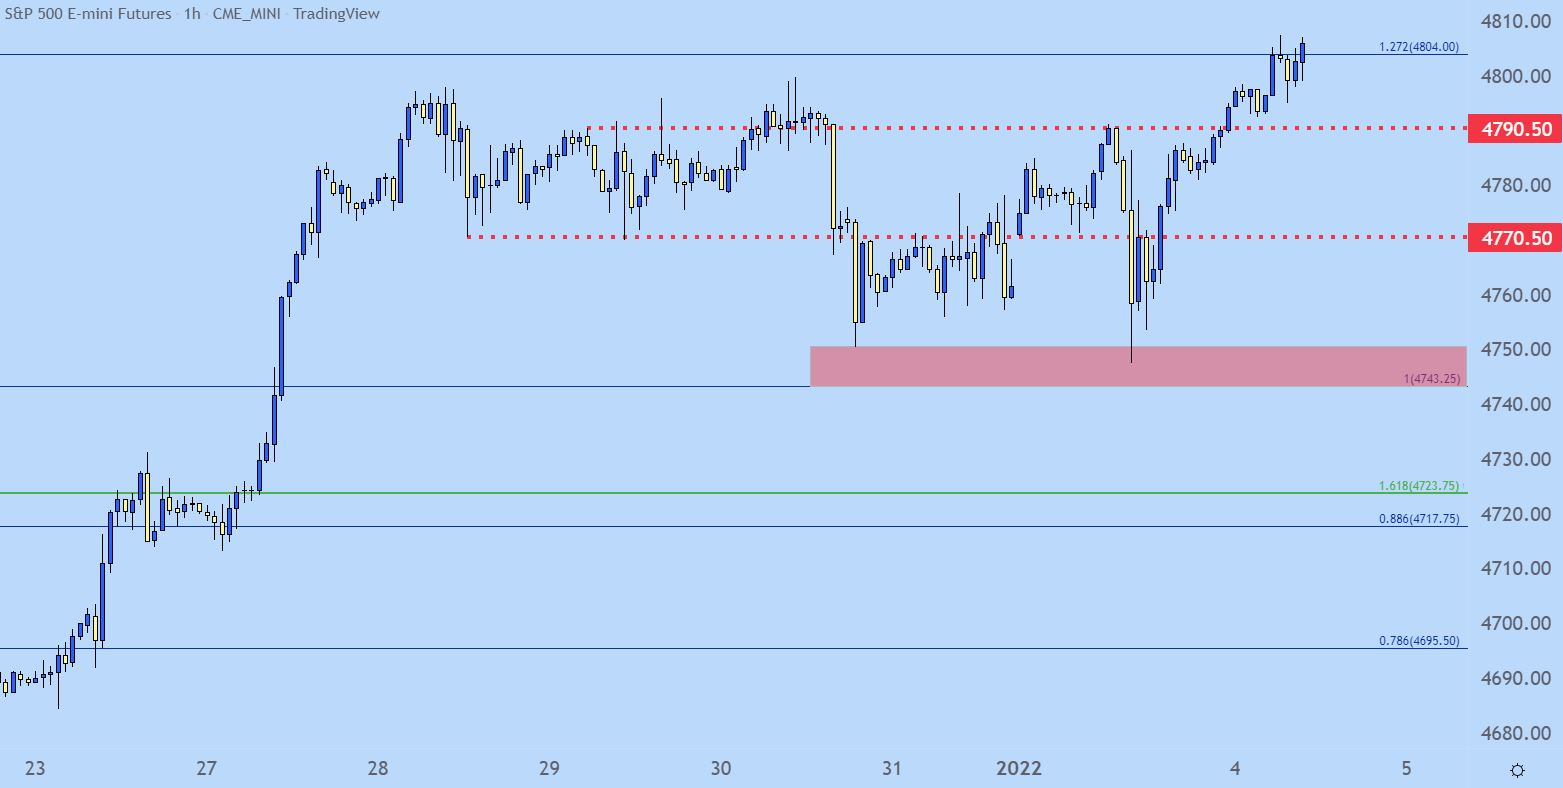
Chart prepared by James Stanley; S&P 500 on Tradingview
S&P 500 Longer-Term
The longer-term bullish trend remains in order in the S&P 500 and given reaction to higher yields, traders looking for short equity plays may want to remain cautious here. There could, perhaps, be another index of note to focus on for near-term pullback or bearish themes, and we’ll look at that after the next chart.
S&P 500 Daily Price Chart

Chart prepared by James Stanley; S&P 500 on Tradingview
Nasdaq 100 Postures Below the Highs
As the blue chip index looked at above continues to tear away to fresher and fresher all-time-highs, the Nasdaq 100 is displaying a bit more sensitive to higher-yield themes. A similar recovery developed in late-December but the big difference is that bulls pulled up shy of re-testing the November high. A lower-high coupled with a pullback last Thursday brought prices back to support, after which a topside move showed yesterday. But, if that lower-high around 16,650 remains defended, the door is open for a deeper pullback.
Nasdaq 100 Four-Hour Price Chart

Chart prepared by James Stanley; Nasdaq 100 on Tradingview
Nasdaq 100 Longer-Term
Taking a step back on the index shows a similar albeit lesser bullish outlay than what was looked at above in the S&P 500. The posturing below the highs here is what’s notable, even as the S&P 500 continues to jump to a fresh high watermark.
At this stage forecasting anything more than a pullback would be begging for greater evidence, but given the reticence of bulls to challenge the highs, the door does remain open for a stronger pullback in the index. The prior ath of 16,421 seems notable as this has had numerous items of follow-through support and resistance. And on the bigger-picture support side of the matter, 15,660 is a level of note as sellers haven’t been able to make much fresh ground below that price over the past few months. And in between those prices is the 16k psychological level to go along with a quick swing at 16,121, each of which can be used as targets for short-side approaches or possible supports for a more patient long-focused approach.
Nasdaq 100 Daily Price Chart

Chart prepared by James Stanley; Nasdaq 100 on Tradingview
--- Written by James Stanley, Senior Strategist for DailyFX.com
Contact and follow James on Twitter: @JStanleyFX