


S&P 500, Nasdaq 100, Dow Jones Technical Forecasts: Bearish
- S&P 500 ranged for much of the week after an early-Monday meltdown, 200 DMA holds as resistance.
- Nasdaq 100 found support at the 50% marker of a recent major move, plotted at 13712.
- Dow Jones held above the six-month-low before a late-Friday rally pushed price towards the weekly high at 34700.
- The technical forecast two weeks ago looked at a bearish scenario for equities ahead of the January FOMC rate decision. That’s now in the books and bearish potential remains amidst a very busy economic calendar next week.

The S&P 500 ended the week much better than it started, especially considering the strong rally that developed in the final hour of trade on Friday. As I had looked at two weeks ago the backdrop was getting more-imposing for equities. And with the Federal Reserve rate decision coming up the Fed went into a blackout period which meant no Fed-speak to save the day. That week was also OPEX which had been a bearish factor for equities since last year and that very much remained the case as price action played out.
The prior week saw five consecutive days of aggressive losses in the S&P 500 and that continued through the Monday open. But support eventually played-in around the six-month-low and that held bears at bay for the remainder of the week. Normally, a support hit of that nature following an aggressive sell-off has been treated in a very bullish manner in equities, particularly with the easy-money backdrop provided by the Fed. But, the tides are changing and as we heard at the FOMC rate decision this week, the bank is gearing up for higher rates and tighter policy later in the year. This helped to keep sellers fairly active around resistance, and the 200 day moving average came in for an assist there in helping to hold this week’s highs.
Next week remains extremely busy with important macro items set to be released every day on the economic calendar. That’s on top of a very busy earnings calendar with Google and GM set to report on Monday, Facebook on Tuesday, Amazon on Wednesday and Ford on Thursday amongst a host of others. So, this is not a market without motive and there will be ample drive coming in next week.
But, perhaps the most important factor has already been spoken to and that’s the Federal Reserve. Given the context, it does appear as though the Fed put isn’t what it used to be, and largely because of inflation. The big question now is when that might come back – at what point will the Fed get softer on policy expectations on the basis of equity market weakness. It seems that point is quite far away and this can keep the bearish side of stocks as an attractive theme. The bigger question right now is simply timing and significant market turns aren’t often linear, so we may see another bounce higher before bears are ready to push down to fresh lows. But given the initiation of bearish trends combined with the backdrop, the forecast for all three major US equity indices will be set to bearish for next week.
S&P 500
The S&P 500 put in a strong rally in the final hour of trade on Friday, and this obfuscates last week’s price action as much of the period was back-and-forth range-bound trading. Of course, this developed after price bounced from the six-month-low at 4224 on Monday morning. Given how aggressively sellers had come into the market during the breach of the bullish trendline in the prior week, it made sense to see a bit of mean-reversion developing as a combination of short cover and traders trying to play a support bounce offset selling pressure from new entrants.
S&P 500 Weekly Price Chart

Chart prepared by James Stanley; S&P 500 on Tradingview
S&P 500 Daily
The daily chart holds more information that may be highlighting potential for a bounce. I’m keeping the forecast at bearish given the larger trend and the fact that I do not think a meaningful rally can extend for long given the current fundamental backdrop, even with so many risk events on the calendar for next week. Daily RSI is coming off of oversold conditions and while this can be a terrible timing indicator, it does highlight the difficult of selling an already oversold market which can be a contributing factor to sellers holding back for now.
For resistance, there’s considerable attention around the 4400 spot but I’m more interesting in 4500, which was the level that held the pullback in early-December, just after the Omicron variant began to create waves across global markets. And there’s a deeper spot of resistance potential at the prior support zone of 4590-4600.

S&P 500 Daily Price Chart
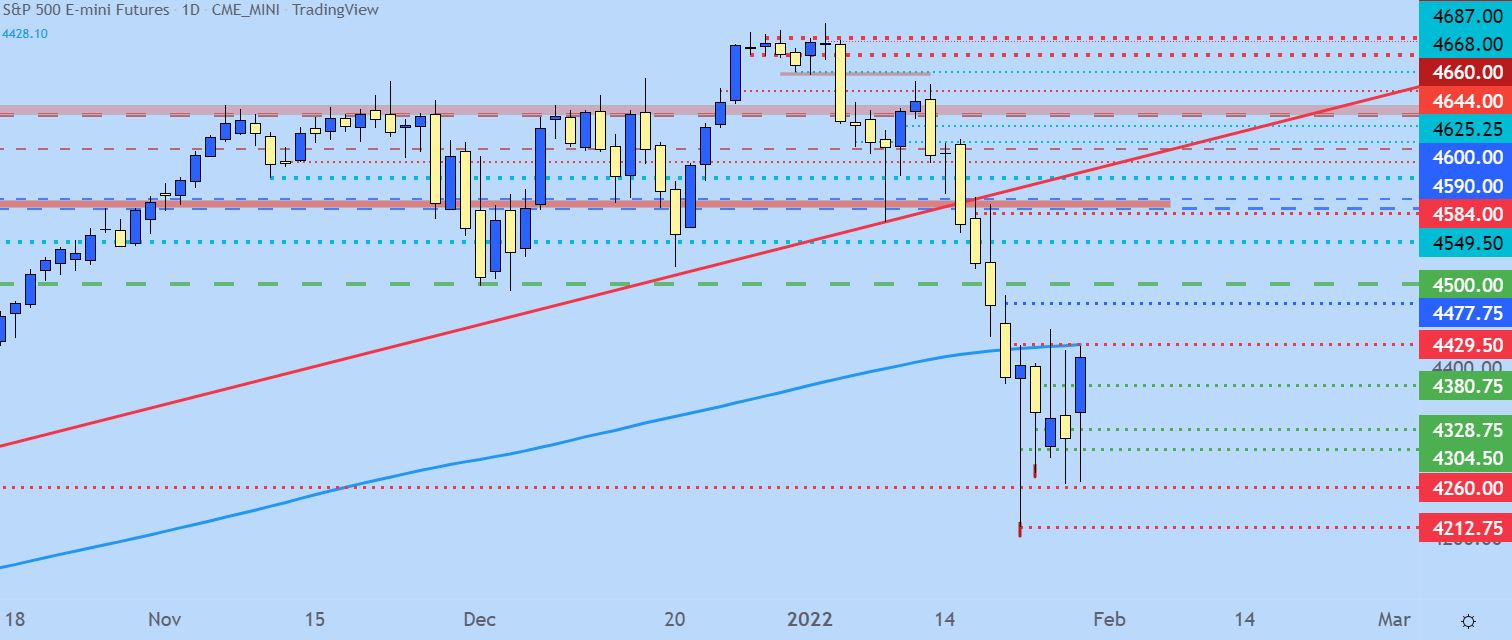
Chart prepared by James Stanley; S&P 500 on Tradingview
Nasdaq 100
As I looked at two weeks ago the Nasdaq 100 shows a more bearish picture and that observation remains as we near the February open. After the aggressive Monday sell-off took hold prices in the Nasdaq 100 pushed all the way down to the 50% marker of the Sept 2020 – November 2021 major move. This level plots at 13712 and, so far, it’s helped to arrest the decline in the index.
But, the Nasdaq 100 is one trading day away from finishing its most bearish month since October of 2008. This, of course, is when the Financial Collapse was doing the driving so the fact that the tech-heavy index has already put in such a move to start 2022 is notable. But that does not imply that it’s over yet.
Like the S&P 500 above, price action put in a massive move in a short period of time and that’s led to a dose of indecision. The weekly bar on the index closed as a doji, highlighting the overall indecisive nature of the market after the early-year sell-off. But the main driver here remains very real and until the Fed relents, if they do at all, the index remains vulnerable to a deeper, more aggressive wave of selling. I’m holding the forecast to bearish here as well.
Next resistance in the Nasdaq 100 can be sought at 14602, 14816 and then the 15k psychological level. Support remains at 14,059, 13,900 and then 13,712.

Nasdaq 100 Weekly Price Chart

Chart prepared by James Stanley; Nasdaq 100 on Tradingview
Dow Jones
The Dow is the one major US equity index that did not set a fresh six-month-low this week. It did set a fresh three-month-low but that’s somewhat positive in comparison to the two indices looked at above. The daily chart here is a sight to behold as there’s been very long wicks on each of this week’s daily candles, again highlighting some extreme indecision after the bearish move took hold to begin 2022 trade.
Given the pause after the sell-off, I’d default this indecision towards near-term strength but with an eye on resistance for possible lower-highs in-front of bearish continuation. This can put focus for resistance potential around the 35k level.
While the Dow may be a bit less exciting than either the Nasdaq 100 or the S&P 500 for breakdown scenarios, given the support test this week combined with the larger overall issue on the fundamental side, the forecast will be set to bearish here, as well.
For those that are looking to trade mean-reversion, given the less dramatic backdrop that’s shown in the Dow v/s the S&P and the Nasdaq, there may be greater potential for that here. The below guide talks about range trading strategies.

Dow Jones Daily Price Chart
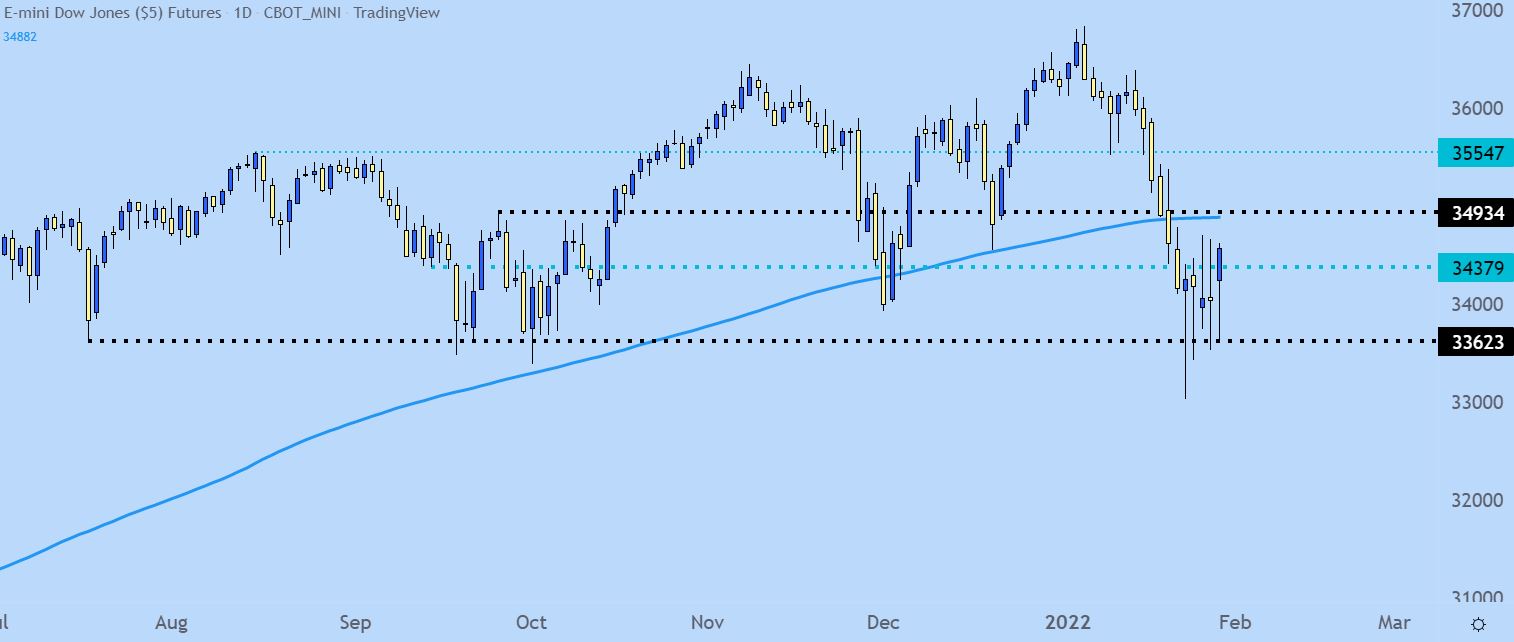
Chart prepared by James Stanley; Dow Jones on Tradingview
--- Written by James Stanley, Senior Strategist for DailyFX.com
Contact and follow James on Twitter: @JStanleyFX


