

Crude Oil Technical Forecast: WTI Weekly Trade Levels
- Crude Oil updated technical trade levels – Weekly Chart
- WTI rebounds off support – looking to validate completion of correction into August
- New to Oil Trading? Get started with this Free How to Trade Oil-Beginners Guide
Crude oil prices snapped a three-week losing streak with WTI now up more than 12% off the July lows. The focus is on this recovery off technical support and the battle lines are drawn heading into the August open. These are the updated targets and invalidation levels that matter on the oil price weekly technical chart. Review my latest Strategy Webinar for an in-depth breakdown of this crude oil price technical setup and more.
Crude Oil Price Chart – WTI Weekly
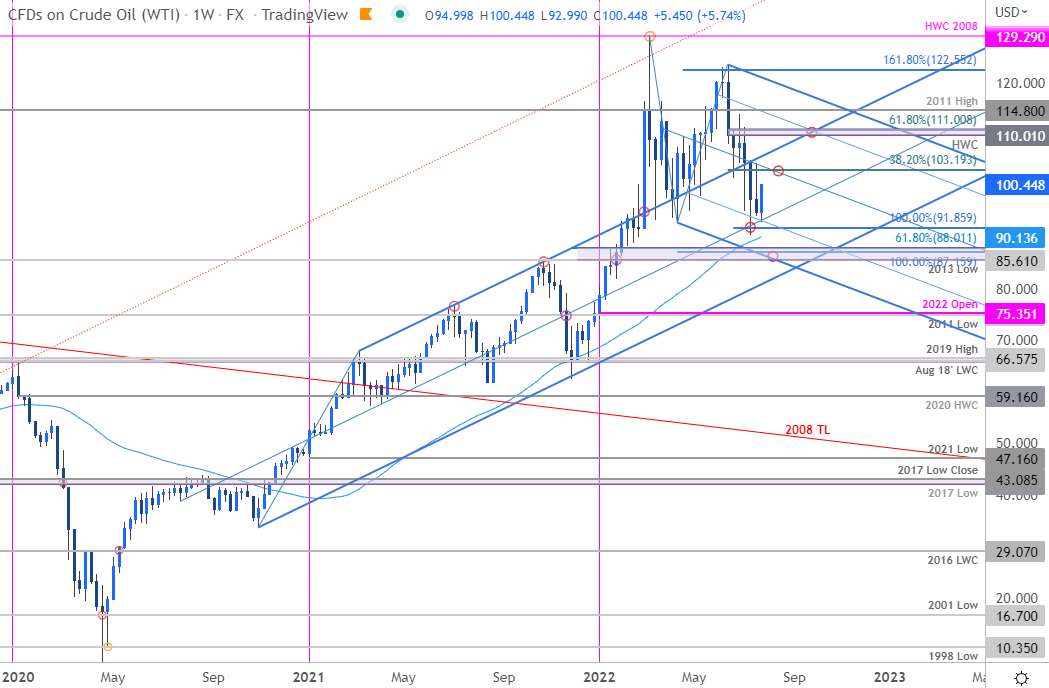
Chart Prepared by Michael Boutros, Technical Strategist; Crude Oil (WTI) on Tradingview
Notes: In my last Crude Oil Weekly Technical Forecast we noted that the WTI, “correction is now probing levels of interest for possible support. From a trading standpoint, a good zone to reduce portions of short-exposure / lower protective stops…” Oil is up more than 5.7% this week to trade back above 100 ahead of the US close on Friday. Is this the low we’ve been searching for? It’s too soon to tell and while the threat for another washout remains, we’ll be looking for validation heading into the August open.
The focus is on this rebound off confluent median-line support with initial weekly resistance eyed at the 38.2% % Fibonacci retracement of the June decline at 103.19. Key resistance is eyed at the June high-week reversal close / 61.8% retracement at 110.01-111 – a breach / weekly close above this threshold would be needed to suggest a more significant low as registered this month / possible resumption of he boarder uptrend. Weekly support remains unchanged at 91.85 backed by broader bullish invalidation at 85.61-88.01- a region defined by the 2013 low, the 100% extension of the March decline and the 61.8.% retracement of the November advance.

Bottom line: Heading into the August open the focus remains on confirming a potential exhaustion low off one of these levels in the weeks ahead IF the broader multi-year oil uptrend is to remain viable. From a trading standpoint, losses should be limited to the low-close (~95) IF a larger turn is underway with a close above 111 ultimately needed to mark resumption. That said, stay nimble into the monthly / weekly open – another probe into uptrend support may offer more favorable opportunities. Review my latest Crude Oil Short-term Technical Outlook for a closer look at the near-term WTI technical trade levels.
For a complete breakdown of Michael’s trading strategy, review his Foundations of Technical Analysis series on Building a Trading Strategy
Crude Oil Trader Sentiment – WTI Price Chart
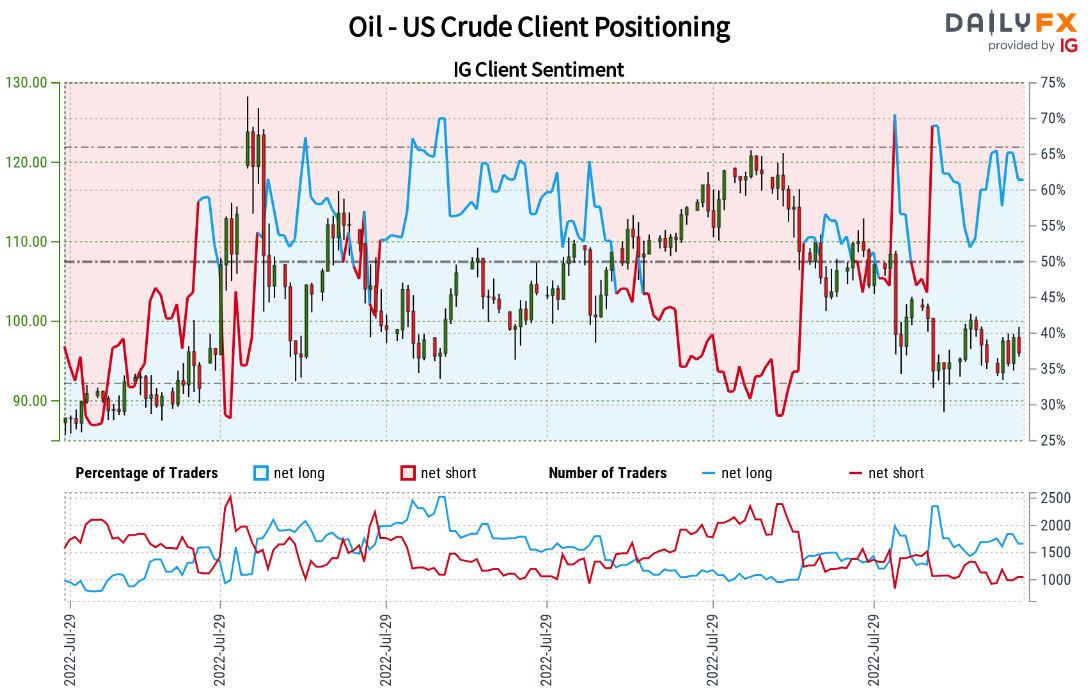
- A summary of IG Client Sentiment shows traders are net-long crude oil - the ratio stands at +1.44 (59.03% of traders are long) – typically weak bearishreading
- Long positions are3.02% higher than yesterday and 3.47% lower from last week
- Short positions are11.59% lower than yesterday and 0.09% higher from last week
- We typically take a contrarian view to crowd sentiment, and the fact traders are net-long suggests WTI prices may continue to fall. Traders are more net-long than yesterday but less net-long from last week. The combination of current positioning and recent changes gives us a further mixed crude oil trading bias from a sentiment standpoint.
| Change in | Longs | Shorts | OI |
| Daily | -5% | -3% | -4% |
| Weekly | -11% | 22% | 2% |
---
Active Weekly Technical Charts
- Australian Dollar (AUD/USD)
- British Pound (GBP/USD)
- US Dollar Index (DXY)
- Canadian Dollar (USD/CAD)
- Euro (EUR/USD)
- Gold (XAU/USD)
- S&P 500, Nasdaq, Dow
- Silver (XAG/USD)

--- Written by Michael Boutros, Technical Strategist with DailyFX
Follow Michael on Twitter @MBForex