


US Stock Indices Technical Forecast: Weekly Trade Levels
- SPX500 support ~3900/06, 3734, 3664- resistance 4156/79, 4321, 4368
- Nasdaq support 12062, 11622, 11119- resistance 12668, 13242, 13580
- Dow support at 31392, 29794, 28323- resistance 32272, 33046, 34006/164
Stocks snapped a three-week losing streak with the S&P 500, Nasdaq and the Dow Jones Industrial Average closing markedly higher for the week. The technical stance of the indices highlight further upside potential near-term, but only within the confines of the broader yearly downtrend and we’re on the lookout for possible topside exhaustion in the days ahead. These are the targets and invalidation levels that matter on the S&P 500 (SPX500), Nasdaq (NDX) and the Dow Jones Industrial Average (US30) weekly technical charts. Review my latest Strategy Webinar for an in-depth breakdown of these technical stock setups and much more.
S&P 500 Price Chart – SPX500 Weekly

Chart Prepared by Michael Boutros, Technical Strategist; SPX500 on Tradingview
Technical Outlook: In last month’s S&P500 Weekly Technical Outlook we noted that that SPX, “breakout is extending towards key technical resistance just higher- risk for price inflection / topside exhaustion ahead.” The level in focus was 4352/68- a region defined by the 52-week moving average and the 61.8% Fibonacci retracement of the yearly range- the index registered a high at 4325 the following week before reversing sharply lower with a three-week decline responding to support this week at the May low-week close / 61.8% Fibonacci retracement of the June advance at 3900/06. Note that basic trendline support extending off the yearly lows also converges on this threshold and further highlights the near-term technical significance of this zone.
Initial weekly resistance now eyed at the 61.8% retracement of the August decline / May 2021 high & low-week close at 4156/79 with a breach / weekly close above January channel resistance needed to suggest a more significant low is in place / larger reversal is underway. A break lower from here exposes once again exposes the 2021 yearly open at 3734 and the 2021 low at 3664 with critical support at the August 2019 high-week close / 50% retracement of the 2020 advance at 3419-3501.

Bottom line: The S&P 500 has rebounded off near-term confluent support – the focus is on possible topside exhaustion on this near-term recovery in the days ahead. From at trading standpoint, look to reduce long-exposure / raise protective stops on a stretch towards / ahead of 4179 IF price is indeed heading lower here with a break threatening another run toward the yearly lows. I’ll publish an updated S&P 500 Short-term Technical Outlook once we get further clarity on the near-term SPX500 technical trade levels.
S&P 500 Trader Sentiment – SPX500 Price Chart
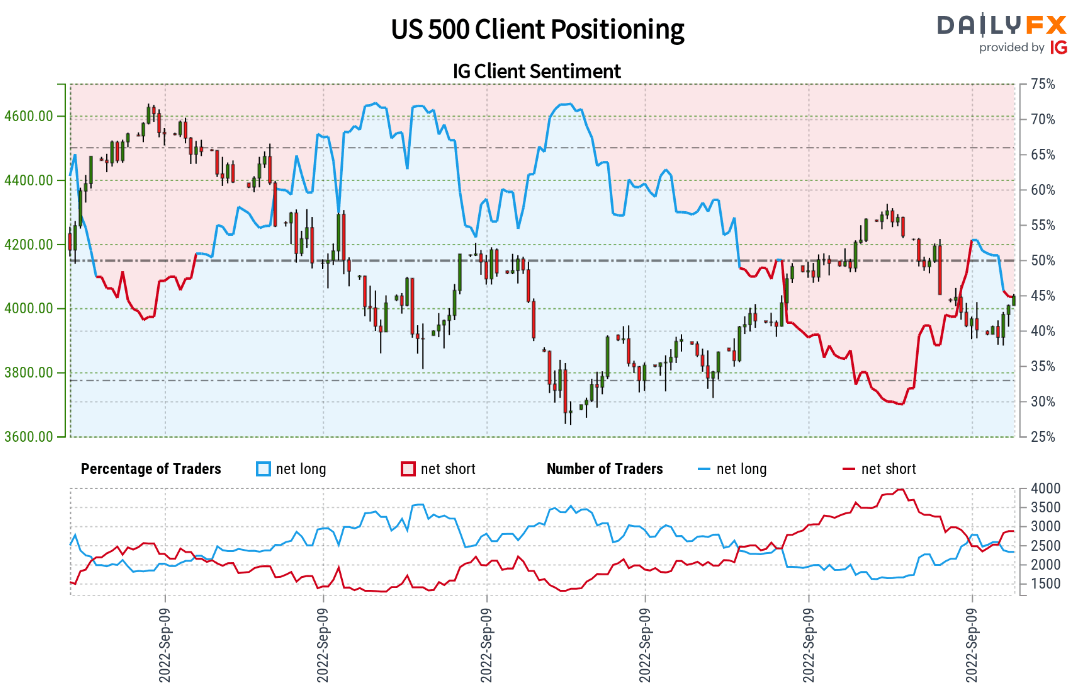
- A summary of IG Client Sentiment shows traders are net-short the S&P 500- the ratio stands at -1.15 (46.41% of traders are long) – typically a neutralreading
- Long positions are0.81% lower than yesterday and 15.27% lower from last week
- Short positions are1.08% higher than yesterday and 10.45% higher from last week
- We typically take a contrarian view to crowd sentiment, and the fact traders are net-short suggests the S&P 500 may continue to rise. Traders are further net-short than yesterday and last week, and the combination of current positioning and recent changes gives us a stronger US 500-bullish contrarian trading biasfrom a sentiment standpoint.

Nasdaq 100 Price Chart – NDX Weekly

Chart Prepared by Michael Boutros, Technical Strategist; NDX on Tradingview
Notes:The Nasdaq turned from confluent resistance last month around the 2021 February high-week close at 13580- the index plummeted more than 13% in the subsequent three-weeks before rebounding off support this week at the 61.8% retracement of the June rally at 12062. The immediate focus is on this near-term recovery.
Initial weekly resistance now eyed at the 2021 low-week close at 12668 backed by August high-week close at 13242. Broader bearish invalidation now lowered to the February 2021 high-week close at 13580. A break lower form here keeps the focus on subsequent support objectives at the September 2020 high-week & low- week closes at 11622 and 11119 respectively with a more significant level eyed at the 61.8% retracement of the 2020 advance at 10589.
Bottom line: Nasdaq has rebounded off Fibonacci support and we’re tracking this recovery for possible topside exhaustion in the days ahead. From at trading standpoint, look to reduce long-exposure / raise protective stops on stretch towards / ahead of 13242 – rallies should be limited to this threshold IF price is indeed heading lower with a break if this week’s low threatening a retest of the yearly extremes. Review my latest Nasdaq Short-term Technical Outlook for a closer look at the near-term NDX technical trade levels.
Dow Jones Industrial Average Price Chart – US30 Weekly

Chart Prepared by Michael Boutros, Technical Strategist; US30 on Tradingview
Notes: The Dow Jones made a deep probe of Fibonacci support this week before rebounding off basic trendline support extending off the yearly lows. Similar to the S&P and the Dow, there may be further upside potential here within the broader downtrend and the focus is on possible exhaustion on this recovery in the days ahead.
Initial resistance at the February lows (32272) backed by the 61.8% retracement of the August decline at 33046. Ultimately, a breach / above yearly channel resistance would be needed to suggest a larger trend reversal is underway. A break of the weekly lows here would shift the focus back towards Fibonacci support / the yearly lows at 29653/794- losses below this threshold could fuel another accelerated bout with the next major support zone at the November 2020 uncovered gap near 28323.
Bottom Line: The Dow has recovered off near-term uptrend support and the threat rises for possible exhaustion ahead of the broader yearly downtrend. From a trading standpoint, look to reduce long-exposure / raise protective stops on a stretch towards / head of 33046 – rallies should be limited to yearly channel resistance IF price is heading lower with a break of this week’s low needed to fuel the next leg lower in the Dow. Keep in mind we have US inflation data on tap next week ahead the FOMC rate decision later this month. Things are likely to get very interesting- keep nimble and stay tuned! Review my latest Dow Jones Short-term Technical Outlook for a closer look at the near-term NDX technical trade levels.
For a complete breakdown of Michael’s trading strategy, review his Foundations of Technical Analysis series on Building a Trading Strategy
Active Weekly Technical Setups
- Canadian Dollar (USD/CAD)
- Japanese Yen (USD/JPY)
- US Dollar Index (DXY)
- Euro (EUR/USD)
- Crude Oil (WTI)
- British Pound (GBP/USD)
- Gold & Silver
-Written by Michael Boutros, Technical Strategist with DailyFX
Follow Michael on Twitter @MBForex


