


Indices Talking Points:
- Today brings the November FOMC rate decision with the expectation for a 75 basis point hike. The bigger question is what’s next, as markets are currently showing a 47.6% probability of a total of 150 bps of hikes into the end of the year, which deductively would point to another 75 bp hike in December.
- The Dow has jumped by more than 13% since last month’s lows but the S&P and Nasdaq have lagged, with the S&P 500 currently showing a rising wedge formation and the Nasdaq putting in a series of lower-highs over the past week.
- The analysis contained in article relies on price action and chart formations. To learn more about price action or chart patterns, check out our DailyFX Education section.

Is the Fed ready to start talking about slower rate hikes?
Given the blistering pace of recent 75 bp hikes which, historically speaking, aren’t all that common, we may be on the cusp of such an announcement. The bigger question is whether this is the fuel that bulls have been looking for to provoke a larger rally, or if they’ll need greater confirmation of some sort of policy change. Notice that I did not use the word ‘pivot,’ as this term has become wrapped in confusion. And speaking to this, noted Fed watcher Nick Timiraos had some remarks this morning on the matter suggesting that there are three possible shifts that could be described as a pivot.
The first would be one that we’ve already seen, with the Fed hurriedly hiking rates in effort of catching up. The second would be raising rates more slowly. And then, finally, holding rates at a high level as inflation bleeds lower. Notice that he did not mention rate cuts nor the possibility of a return to QE, which, in many circles, has been the pivot of interest.
For the Fed’s part, they’ve been pretty clear. They’re still in stage one, hiking rates in effort of catching up; but from recent Fed-speak, may be nearing stage two. Also speaking to this was the batch of drivers that went out to markets on the morning of Friday October the 21st. Notably, one of the main focal points was an article from Mr. Timiraos, in which he suggested that this rate decision taking place later today would be the spot where Chair Powell would begin to indicate a softening or slowing of rate hikes. This was coupled with some comments from Mary Daly of a similar ilk, which, notably, ran in stark contrast to hear earlier remarks that suggested that the Fed had much more room to go with hikes. And then there was the Bank of Japan intervention which is evidence yet again of how divergence in monetary policy amongst major Central Banks can create pressure, even for the Fed and the USD, which could create even larger problems down-the-road. So, perhaps this is motivation for the Fed to start considering other factors relevant to their rate hike plans?
Whatever the cause – the result has been undeniable. That Friday led to a strong rally after those reports were issued and US equities have held on to those rallies, to varying degrees, ever since.
The Dow is currently up more than 13% from last month’s lows and at one point, was more than 15% higher. More than half of that is from the lows on the morning of October 21st. The S&P 500 is up a more modest but still respectable 10% with more than half of that gain since that Friday report. The Nasdaq is up by only 7.73% and a little more than 3% from that same inflection point.
And if taken from a vantage point of expecting elevated interest rates to remain, that makes sense, as the tech-heavy Nasdaq is often more rate sensitive and given the disappointing earnings that we’ve heard out of big tech over the past couple weeks, it’s surprising that the index hasn’t performed more poorly.
So, what we’ve seen to this point appears to be a market positioning for a less-aggressive FOMC after a blistering pace of hikes in 2022. To be sure, this wouldn’t be the first type of that theme to get priced-in this year, as a two-month rally from the June lows outpaced a two-week-rally from the March lows, each of which was driven by the hope that the Fed may, in fact, take a softer touch.

The Dow’s Time to Shine?
Amongst major US equity indices the Dow has led the way of recent and, at this point, it’s trading at a fresh two-month-high, at levels that haven’t been touched since Jerome Powell’s speech at the Jackson Hole Economic Symposium. And, even going back to the equity reversal on October 13th, the morning of the CPI release, the Dow did not set a fresh low that day while both the Nasdaq and S&P 500 did.
Notably, this is different than the prior rally that was seen back in June, when the Dow lagged behind both the Nasdaq and S&P 500, so this seems to be markets acknowledging the fact that the Fed probably isn’t done with hikes but may be nearing a shift to a slower trajectory. This would make sense as tech-heavy companies that fill the Nasdaq and populate the S&P 500 would be more constrained given the higher interest rate backdrop; while blue chips with better capitalization may be better fit to weather the path ahead.
As for levels, the Dow has found resistance at a familiar trendline that’s guided the move lower for much of the year. There’s near-term support potential at the Fibonacci level plotted at 32,408, and then there’s a price action swing around 31,900; but given how quickly this rally has come together there’s not much else for nearby support points to look for higher-lows to show. If we do get a deeper pullback, a key test could show around 31,300; and a hold of higher-low support there could even keep the door open to bigger picture bullish continuation scenarios.
Dow Jones Daily Chart
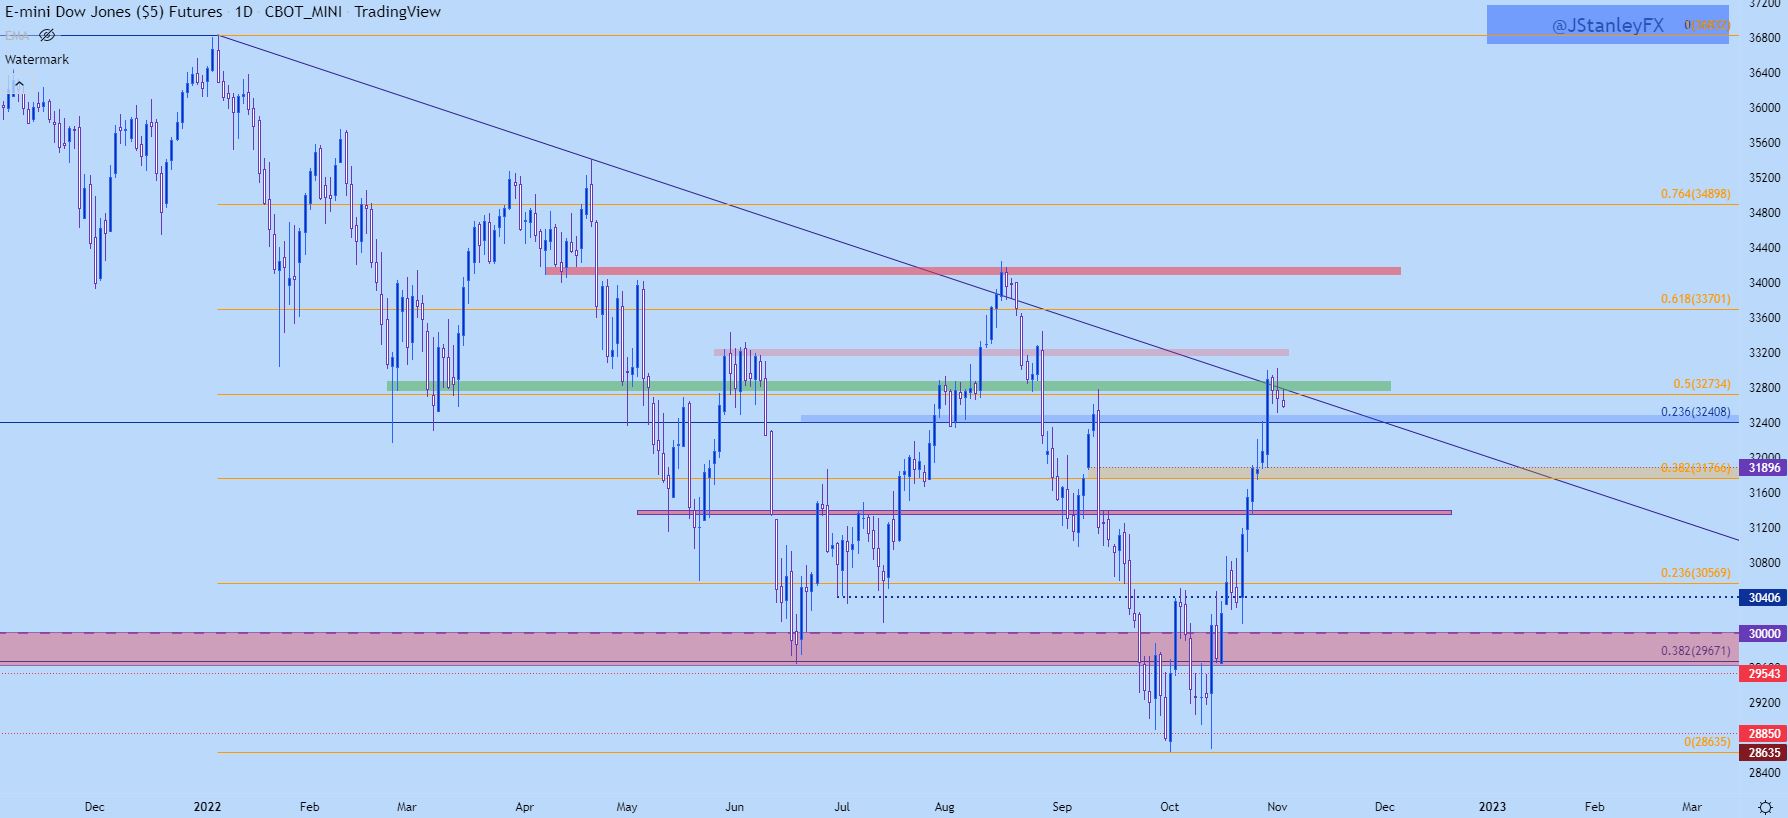
Chart prepared by James Stanley; Dow Jones on Tradingview
S&P 500 Rising Wedge
The S&P 500 set up a bullish reversal formation last month and the timing of that October 21st bounce (I will not call it a pivot, even if it was a pivot in price) had excellent timing as prices had just started to test support at prior wedge resistance.
That slingshot move extended the rally and that continued all the way into the end of last week. The rally was uneven, however, as a rising wedge formed out of that falling wedge formation. And just like the falling wedge is often tracked for bullish reversals, the rising wedge is often tracked for bearish reversals.
This would be a shorter-term observation and below I’m using a four-hour chart. But, this could put the focus on a near-term bearish move with a really big area of possible support coming into the picture quickly, and that plots from around 3802-3820.
S&P 500 Four-Hour Price Chart

Chart prepared by James Stanley; S&P 500 on Tradingview
S&P Bigger Picture
From the daily chart, something else becomes noticeable and that’s how bears have been stymied at or near lows. This is not the collapse-like move that sellers have been looking for this year and as I’ve shared recently, this is more-likely a matter related to sentiment than it is direct fundamentals. Market participants have had a tendency of getting incredibly bearish as new lows come into play and that can be seen in put-call ratios. And then, just like June rallied after a slight push to fresh lows, the same happened again in October, even after another above-expectation inflation print.
So, bears have an open door today given the rising wedge. The support area around 3802-3820 would be a big test after and if sellers can sink price below that, there could be an open door for a push down towards the Fibonacci level at 3660. The big question at that point is whether bulls will come-in to hold price at a higher-low or whether they succumb to selling pressure.

S&P 500 Daily Price Chart

Chart prepared by James Stanley; S&P 500 on Tradingview
Nasdaq
The tech-heavy Nasdaq is likely the focal point of bears and given the lagging reaction over the past few weeks, that makes sense. While both the Dow and S&P have jumped to fresh monthly highs, the Nasdaq has obediently held below a key spot of resistance at the 11,700 level. T his was the same zone that caught the highs earlier in October and after coming into play just after that Friday risk rally, the index has put in a series of lower-highs over the past week.
If the Fed does not talk up slower rate hikes, the Nasdaq could remain as vulnerable. The big test here is going to be around the 11,000 level, which currently marks the weekly low but bigger-picture, has had impact going back to June when the swing-low at 11,068 developed. There’s been a mass of support that’s developed there over the past few weeks that could make working with that area a bit more dangerous.
For bearish approaches, it’s the 10,890 level that remains appealing and if sellers can push below that, then the door opens for tests of 10,767 after which the 10,501 Fibonacci level comes into play.
For bulls – a breach of the 11,700 area of resistance nullifies bearish themes and re-opens the door for longer-term bullish approaches. The move above that resistance could be quick given the tensions that’s built in that zone already over the past few months.
Nasdaq Four-Hour Price Chart

Chart prepared by James Stanley; Nasdaq 100 on Tradingview
--- Written by James Stanley, Senior Strategist, DailyFX.com & Head of DailyFX Education
Contact and follow James on Twitter: @JStanleyFX


