

S&P500, Dow Jones Price Outlook
Have you seen our newest trading guides for USD, EUR and Gold ? Download for free our latest forecasts
Dow Jones - S&P500 - Sellers in Charge
On July 26 S&P 500 printed 3,028 – Its highest level at all times. However, on the following days the index reversed lower then closed on Friday in the red losing near 2.9% of its value. Similarly, the Dow closed the weekly candlestick with rough 2.4% loss.
Alongside this, the Relative Strength Index (RSI) fell sharply on the S&P 500 from 64 to below 50 today, indicating to the seller’s domination. In turn, last week the oscillator on the Dow remained flat around 35 however, today (RSI) dipped below 30 indicating the strength of the downtrend momentum.
Just getting started? See our Beginners’ Guide for FX traders
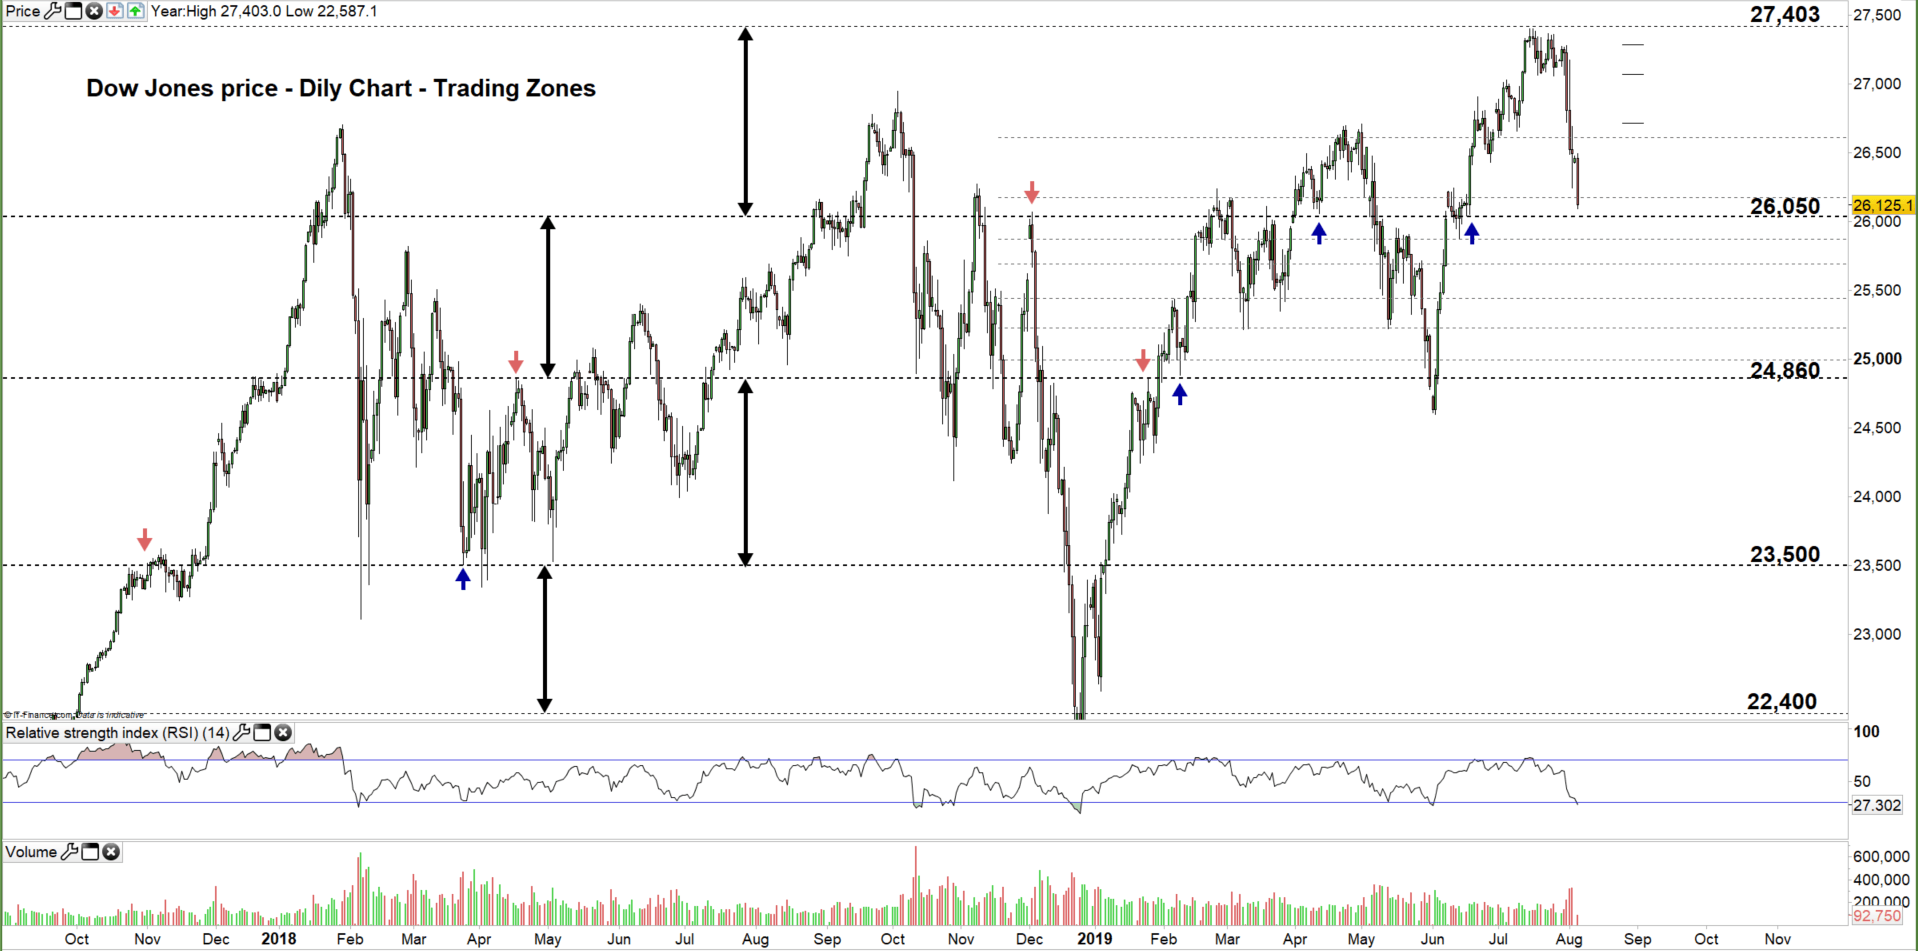
Dow Jones PRICE Daily CHART (Oct 1, 2017 – AUg 5, 2019) Zoomed OUT
Dow Jones PRICE Daily CHART (April 20 – Aug 1, 2019) Zoomed IN
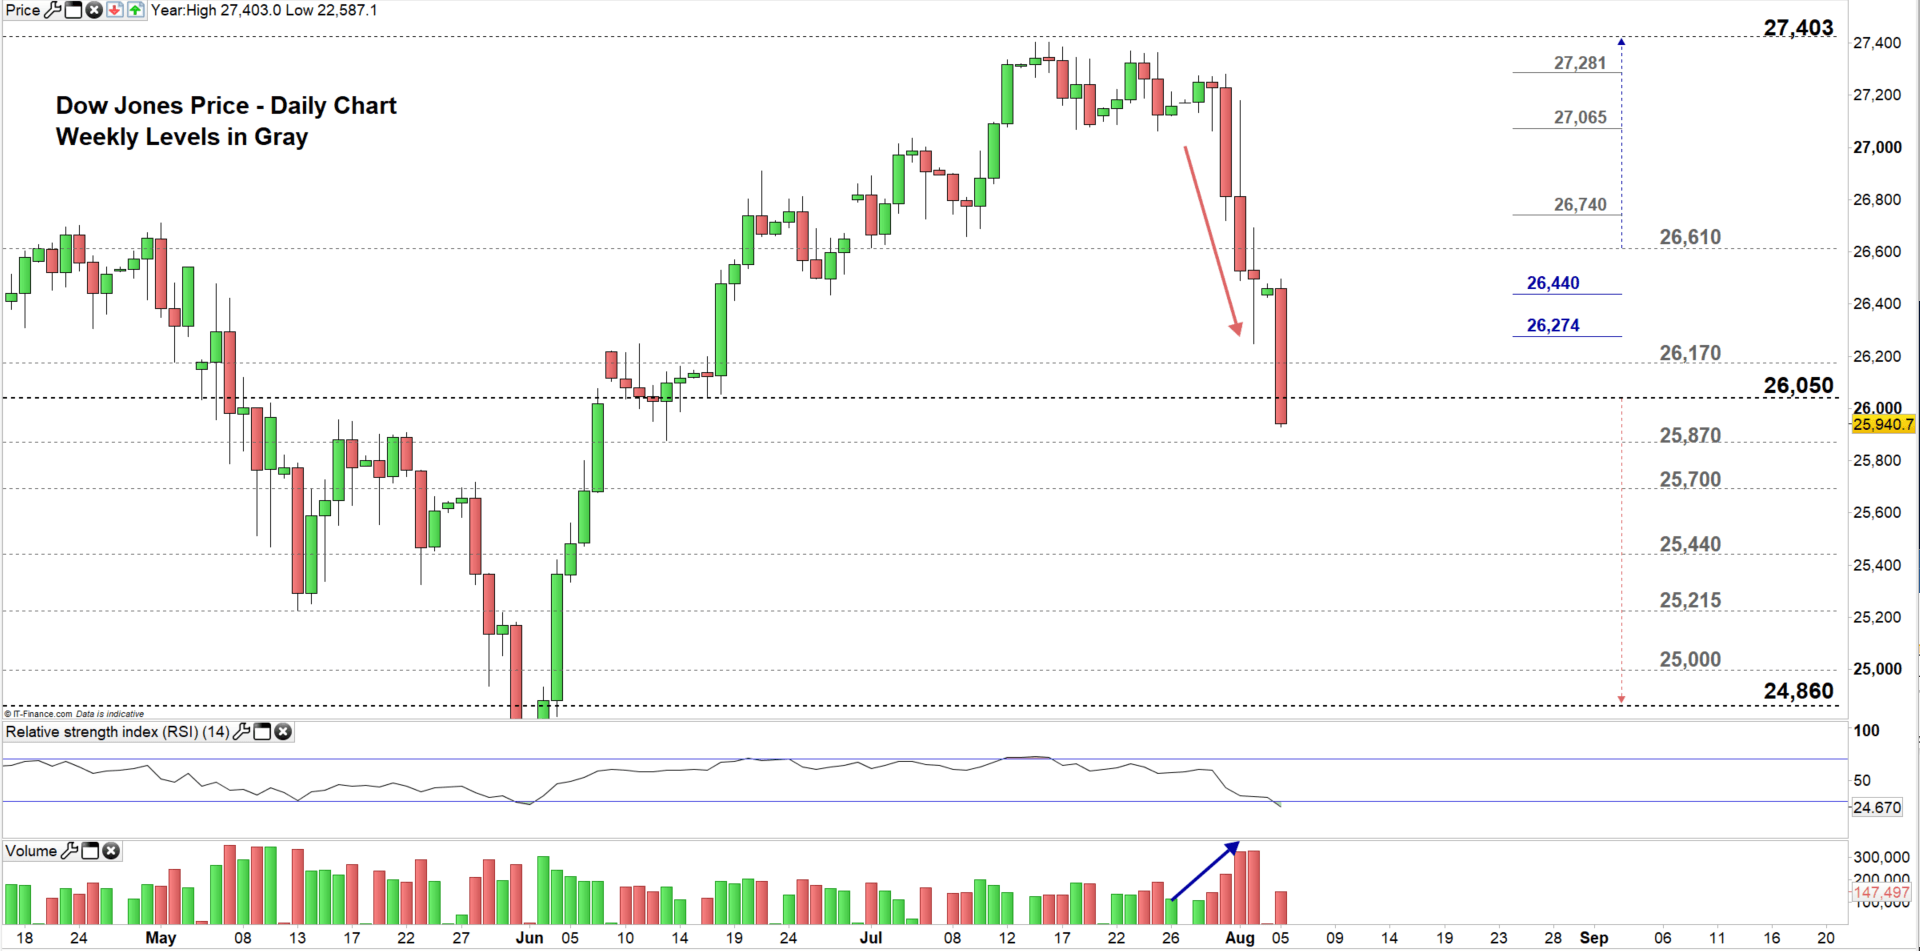
Looking at the daily chart we notice today, the Dow has fallen to the lower trading zone 24,860 – 26,050 and currently eyes a test of the June 13 low at 25,878. Hence, a close below the high end of this zone may press the index towards the low end. Although, the weekly support levels marked on the chart (zoomed in) should be watched along the way.
It’s worth noting the divergence between the current downtrend and the volume. This reflects an aggressive new short selling and may increase the odds that the downtrend may continue.
On the flip side, a close above the high end of the zone could push the price higher towards 26,610. However, the weekly and daily resistance levels underlined on the chart need to be considered.
Having trouble with your trading strategy? Here’s the #1 Mistake That Traders Make
S&P500 PRICE CHART (Aril 30, 2017 – Aug 5, 2019) Zoomed out
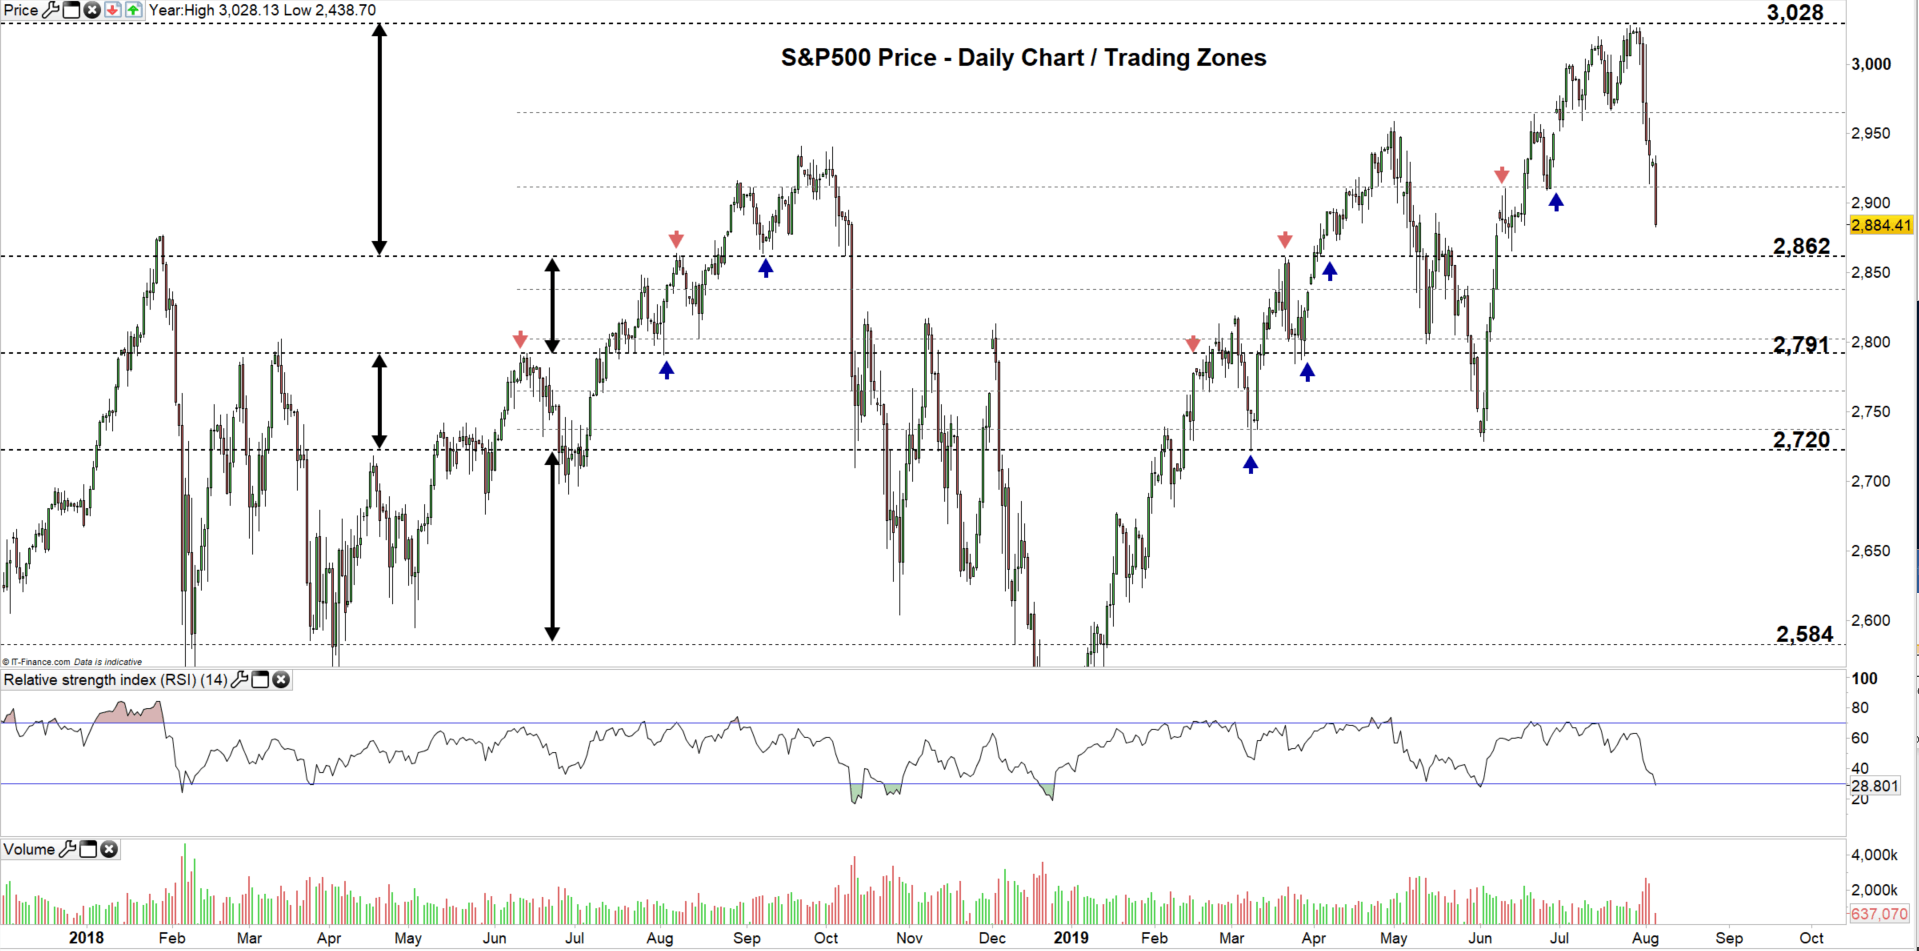
S&P 500 PRICE Daily CHART (May 15 – AUG 5, 2019) Zoomed IN

Looking at the daily chart we notice today, the S&P 500 has declined to the lower trading zone 2,862 – 2,912 and currently looking for a test of the 13 June low at 2,874. Therefore, a close below the low end of the zone may press the index towards 2,791. Nonetheless, the weekly support levels printed on the chart (zoomed in) should be kept in focus.
On the other hand, any failure in closing below the low end of the current trading zone may reverse the price direction towards the high end. Although, the daily resistance area from 2,885 up to 2,895 would be worth monitoring. See the chart to know more about the next significant resistance levels and zones in a further bullish scenario.
Written By: Mahmoud Alkudsi
Please feel free to contact me on Twitter: @Malkudsi