

DXY and Dow Forecast
Have you seen our newest trading guides for USD, EUR and Gold ? Download for free our latest forecasts
Dow Jones and Dollar index- Price Action
Last week the Dow lost nearly 4.0% of its value before the price recovers some of the losses with the sellers likely closing their trades. The Dow closed the weekly candlestick with 1.5% loss only. In turn, the Dollar index (DXY) performed positively and on Friday closed with 0.5 % profit.
Alongside this, the Relative Strength Index (RSI) U-turned on the Dow last Wednesday from 35 then climbed to 45 indicating to a paused downtrend momentum. On the other hand, the oscillator, pointed higher towards 60 on the DXY then remained flat reflating the buyer’s indecision.
Just getting started? See our Beginners’ Guide for FX traders
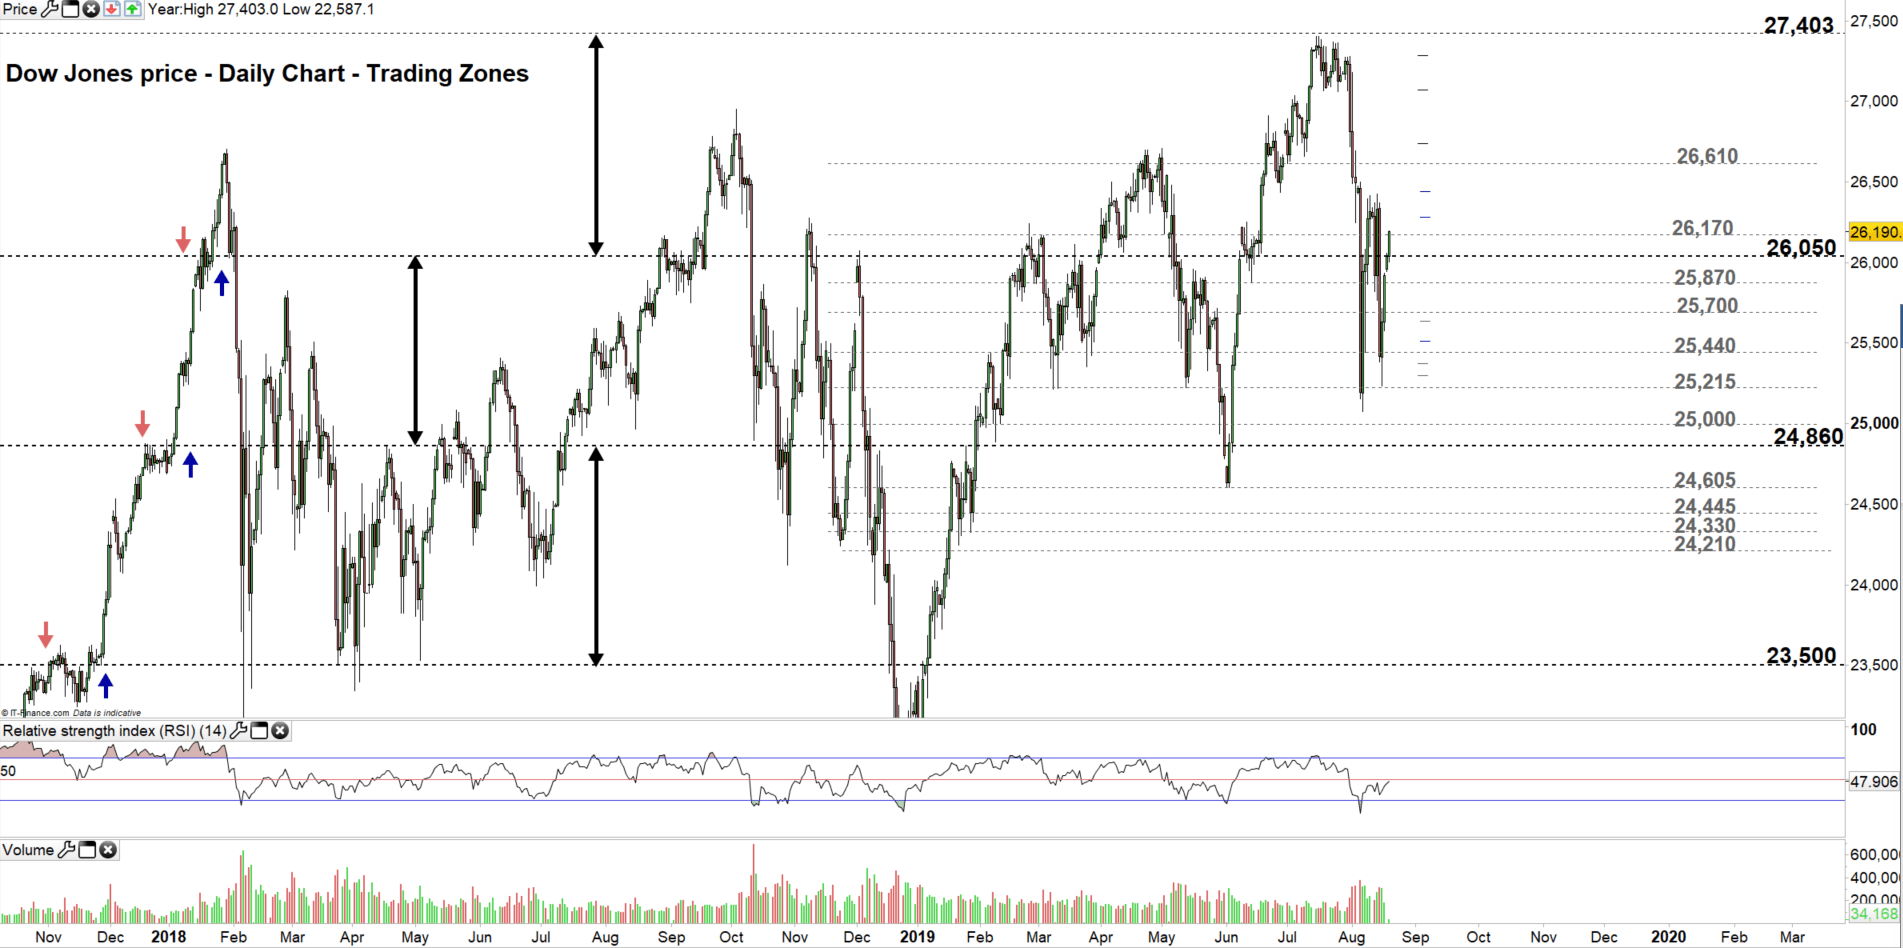
Dow Jones Daily PRice CHART (Oct 25, 2017 – AUg 19, 2019) Zoomed OUT
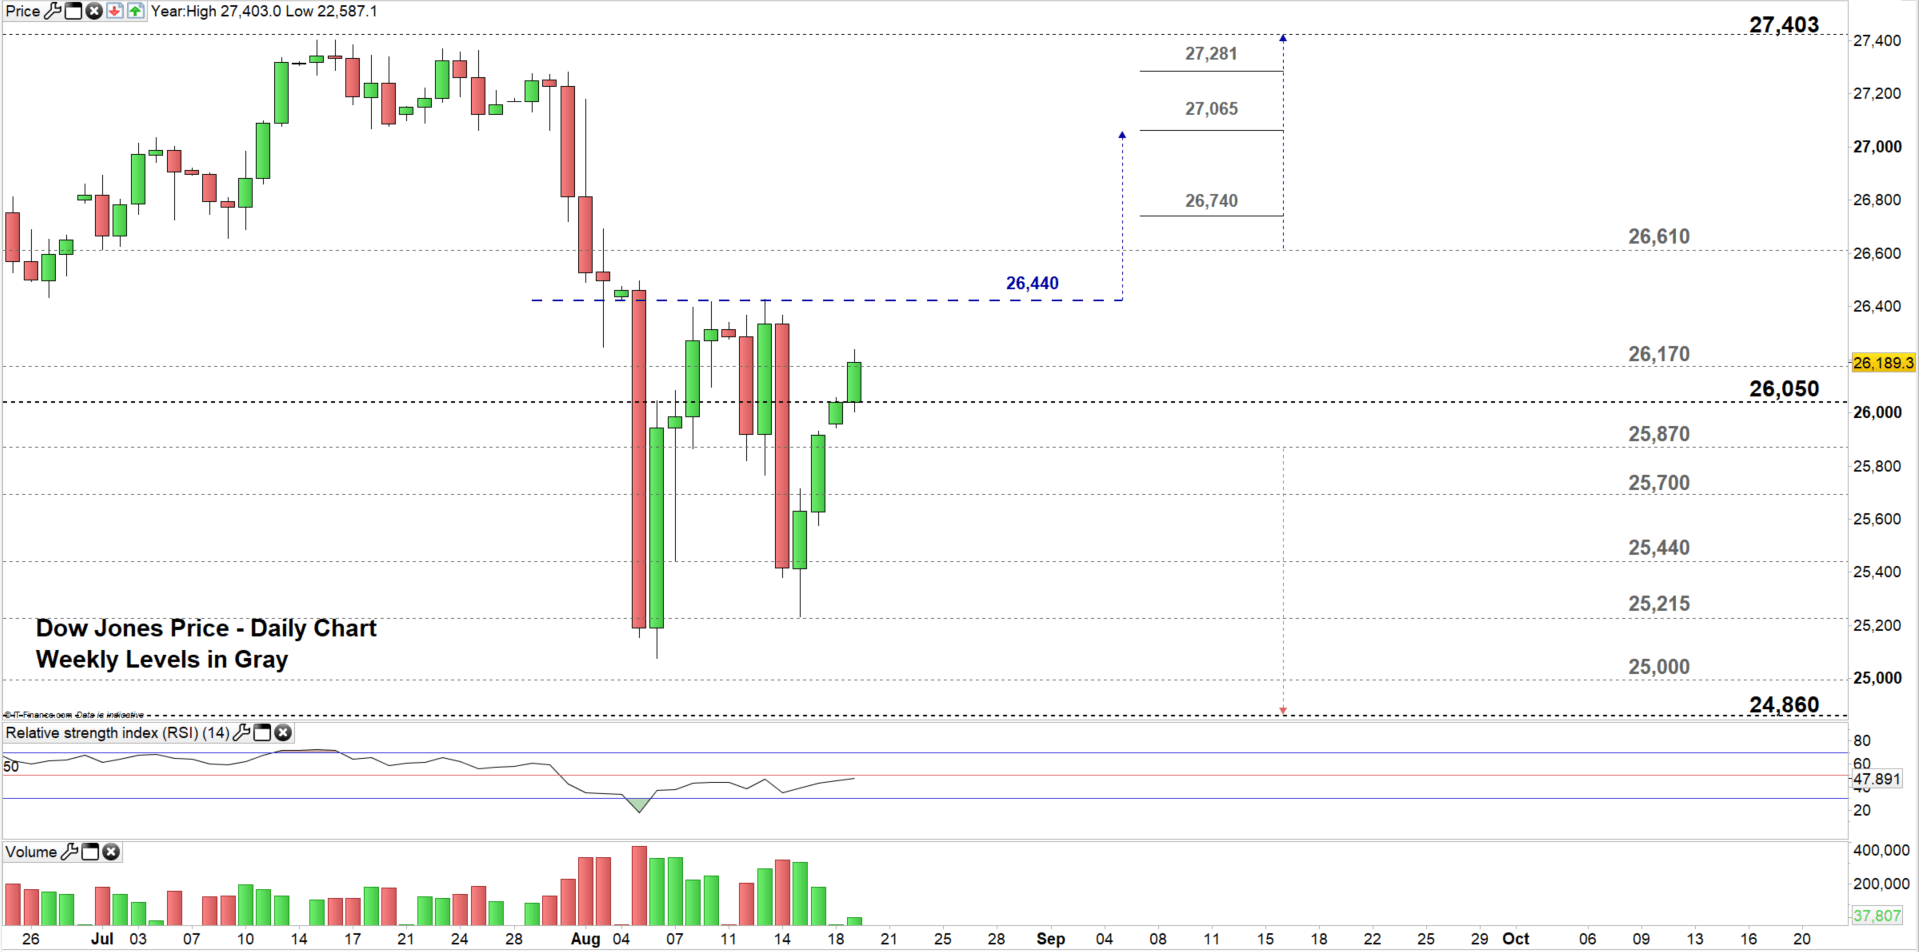
Dow Jones Daily PRICE CHART (June 24 – Aug 19, 2019) Zoomed IN
Looking at the daily chart, we notice at the start of this week the Dow opened with an uptrend gap and currently, the index is moving in the trading zone 26,170 – 26,610.
Thus, a close above the low end of the zone could send the price towards the high end. Although, it’s worth noting that since the August 5 crash the buyer’s attempts to rally the price has been failing nearby 26,440, therefore they may need to clear this level before heading for a test of the high end of the zone.
Further close above the high end, could send the index towards 27,403. However, the weekly resistance levels underlined on the chart (zoomed in) should be watched along the way.
On the flip side, any failure in closing above the low end of the zone, could press the price towards 25,870. Nonetheless, the daily support level 26,050 needs to be monitored. See the chart to know more about the following support levels in a further bearish scenario.
Having trouble with your trading strategy? Here’s the #1 Mistake That Traders Make
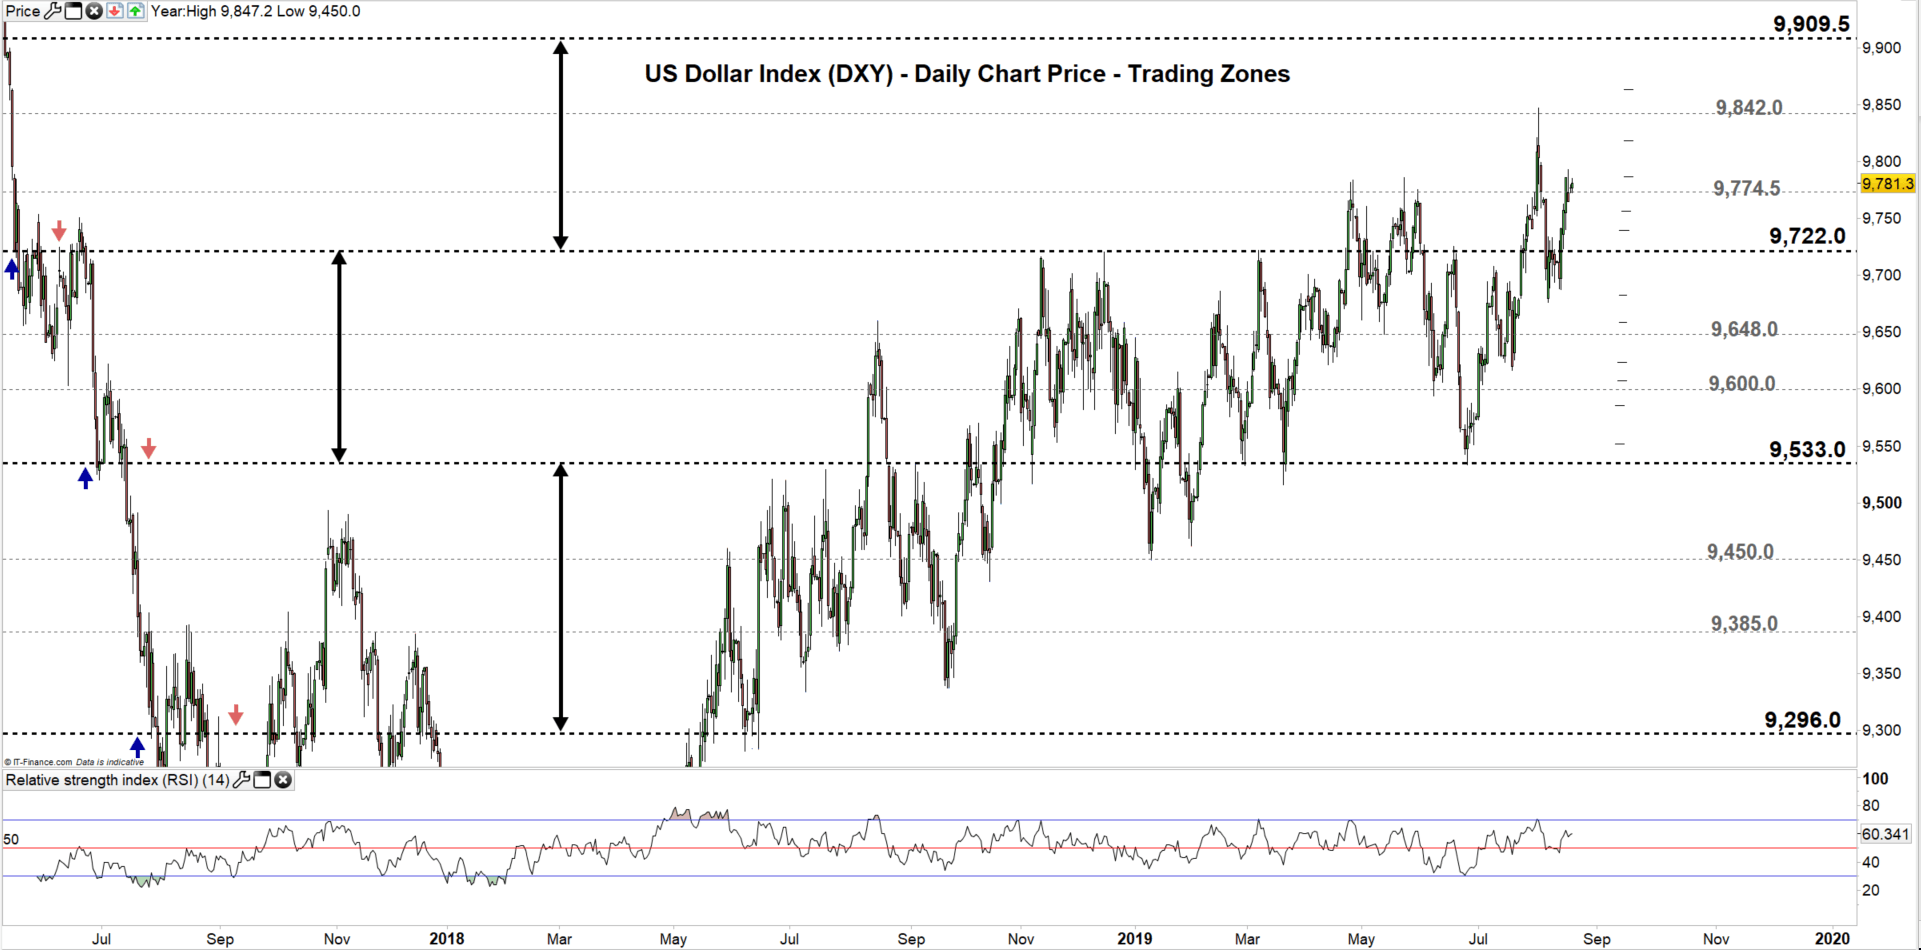
Dollar INDEX Daily PRICE CHART (DEC 20, 2018 – Aug 19, 2019) Zoomed out
Dollar Index Daily PRice CHART (May 30 – AUG 19, 2019) Zoomed IN
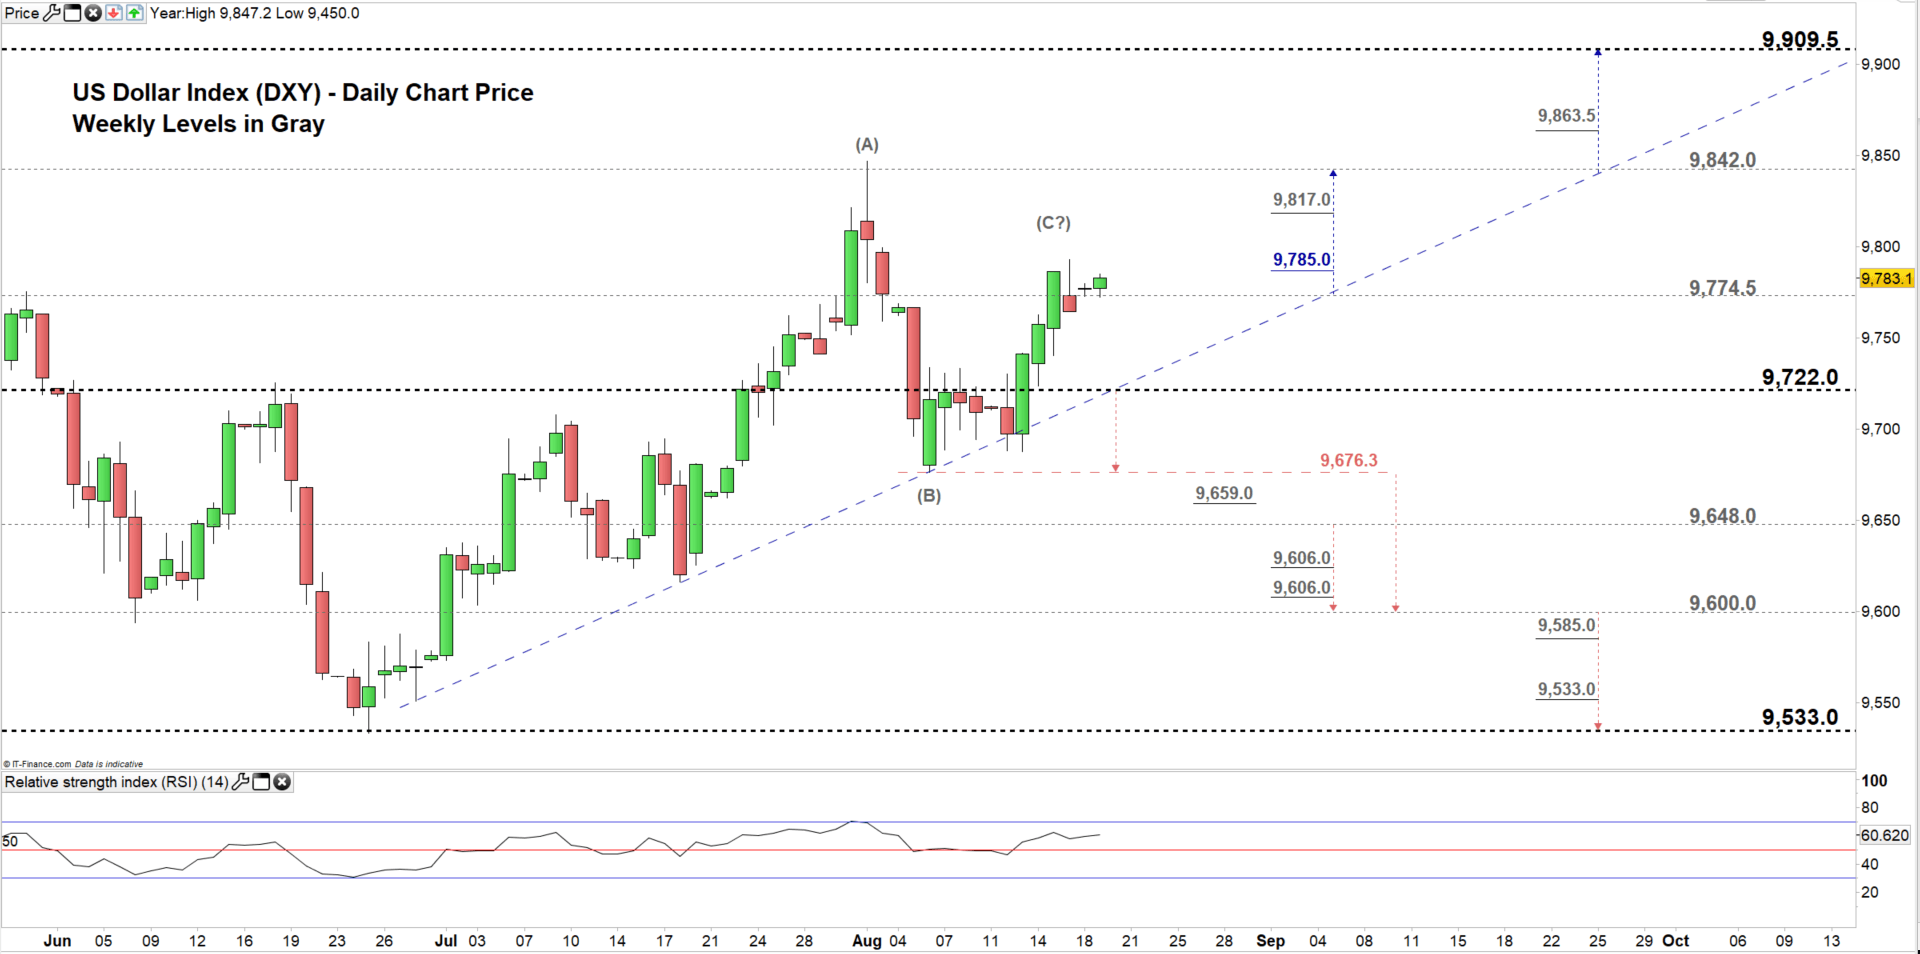
Looking at the daily chart, we notice on August 6 the US Dollar index (DXY) rebounded from 9,676.3 then rallied to a higher trading zone 9,774.5 – 9,842.0.
Hence, any close above the low end of current trading zone may push the price to the high end. Although, the daily and weekly resistance levels underlined on the chart (zoomed in) should be considered.
On the other hand, a close below the low end could press the index towards 9,722.0 (convergence point with the uptrend line originated from the June 28 low). Further close below this level may send the price towards 9,648.0. Nonetheless, a special attention needs to be paid to the aforementioned August 6 low. See the chart to know more about the lower trading zone with the weekly support levels the DXY would encounter in a further bearish scenario.
Written By: Mahmoud Alkudsi
Please feel free to contact me on Twitter: @Malkudsi