

Dow Jones Outlook
- Dow Jones charts and analysis

Dow Jones – Price Action
Last week, the Dow Jones printed 29,057- it’s all time high. However, the index declined after and settled below 29,000 handle. The price closed on Friday in the green with a 0.6% gain.
Alongside this, the Relative Strength Index (RSI) remained flat above 50 highlighting a weaker uptrend momentum.
Just getting started? See our Beginners’ Guide for FX traders
Dow Jones PRICE Daily CHART (July 1, 2018 – Jan 13, 2020) Zoomed OUT
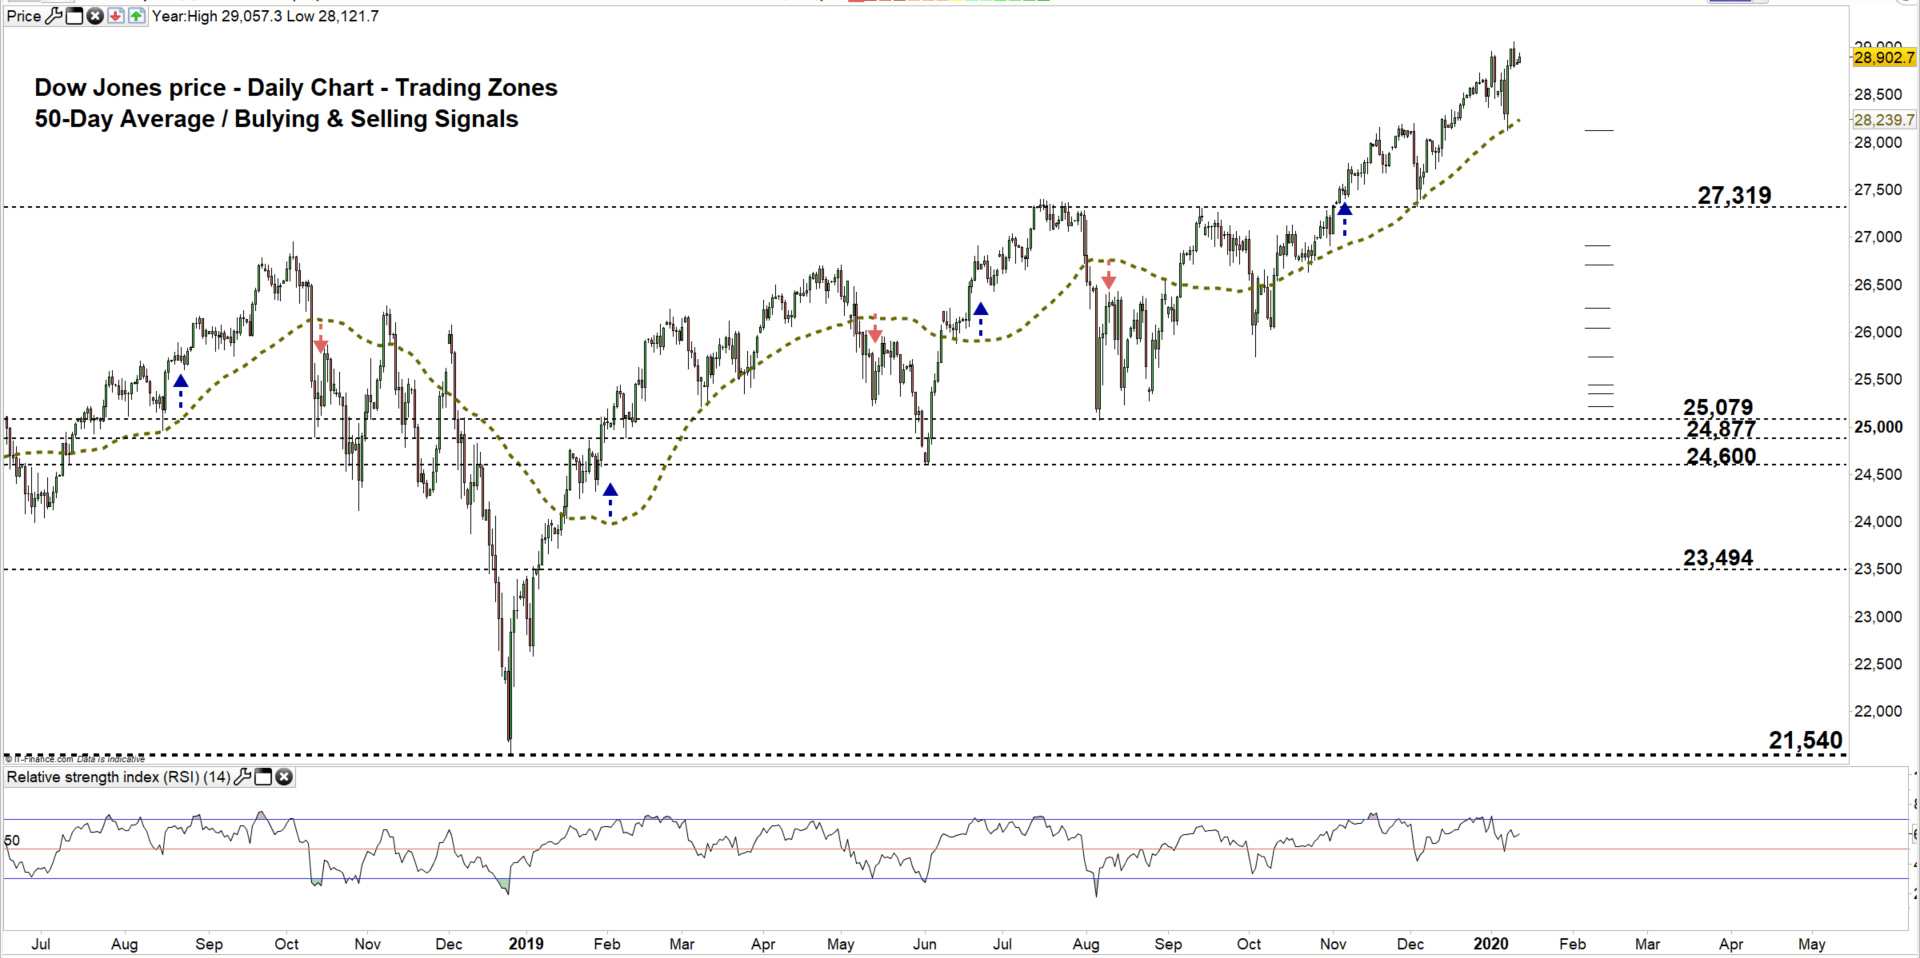
Dow Jones PRICE Daily CHART (AUg 8 – Jan 13, 2020) Zoomed IN

Looking at the daily chart, we notice on Wednesday the Dow retraced to its lowest level in 2020 at 28,128. Currently, the price is still trading in the upside channel originated form the Oct 3 low at 25,736.
It’s worth noting the bearish divergence between RSI and the price (a high with a higher high on the price with high and a lower high on the oscillator). This signals a possible uptrend reversal.
A close below 27,319 may lead more buyers to exit the market. This could send the price towards 25,079. That said, the weekly support levels marked on the chart should be considered as some traders may exit/ join the market at these levels.

Dow Jones Four Hour PRICE CHART (DEC 20, 2018 – Jan 13, 2020)
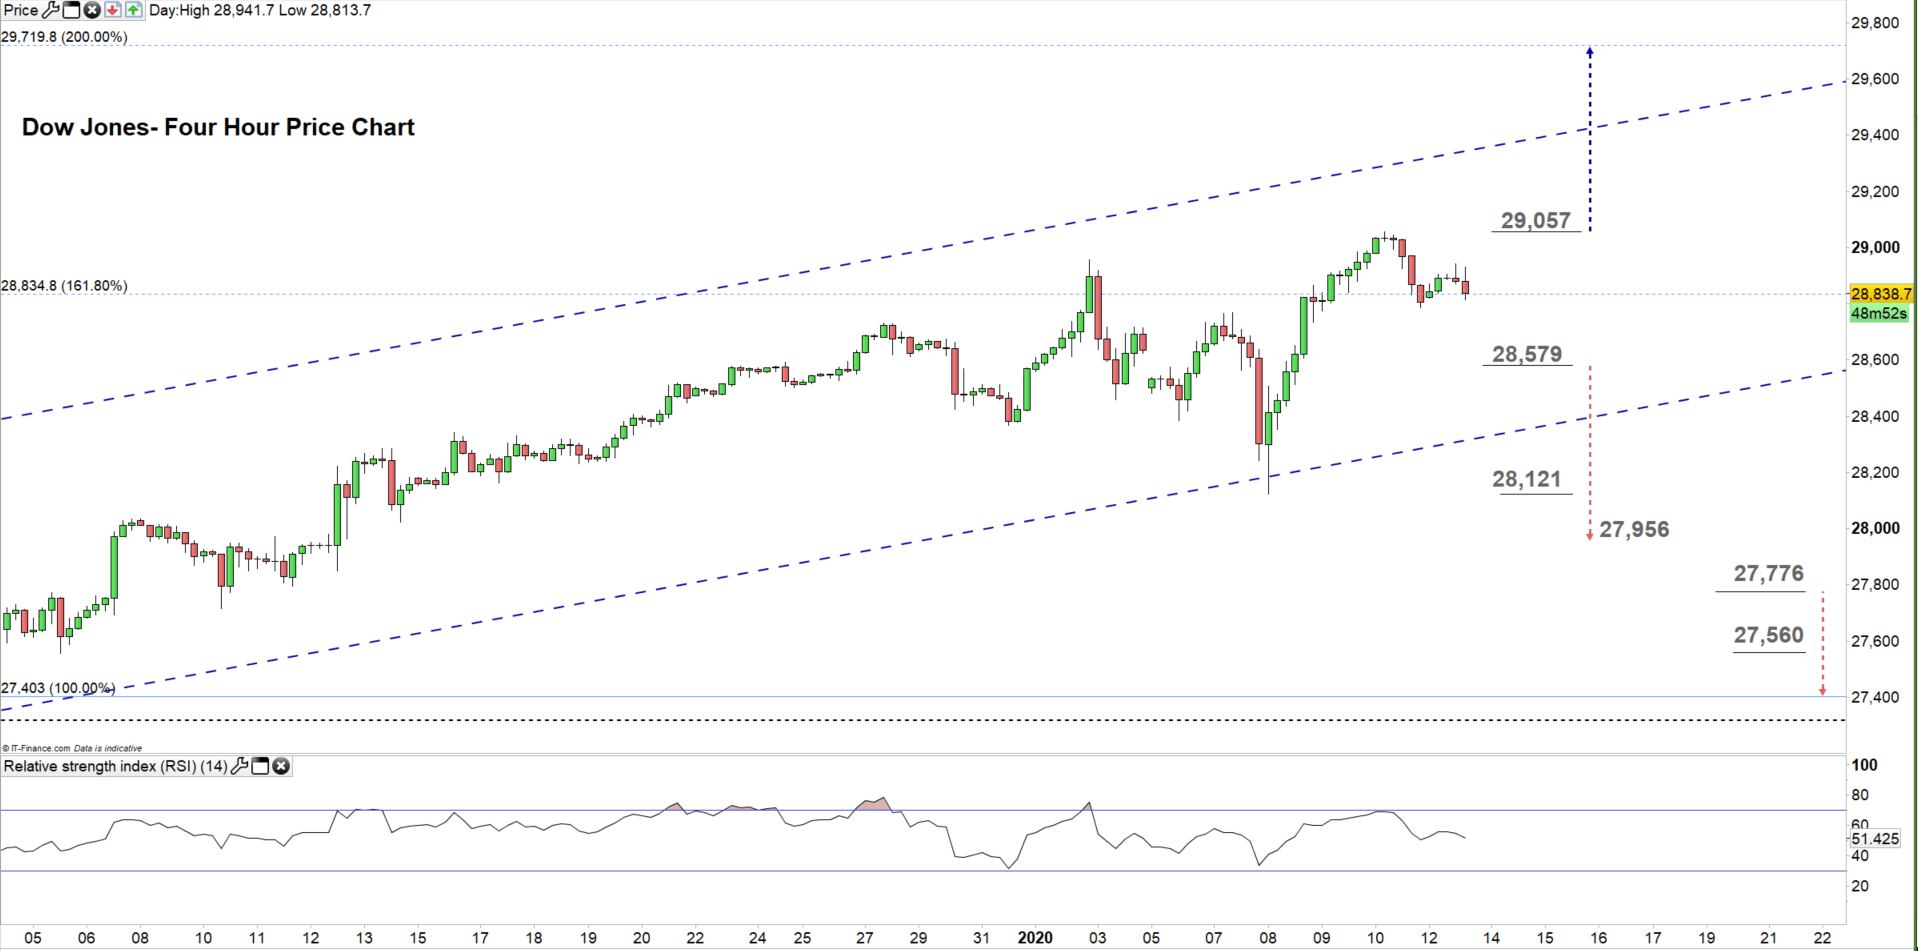
Looking at the daily chart, we notice on Friday the Dow Jones tested trading below the Fib extension 161.8% at 28,834. The price opened this week with a gap to the upside. However, remained trading nearby the Fib Extension level.
A break below 28,579 could press the Dow towards the weekly support at 27,956. Although, the lower line of the upward channel discussed on the daily chart with the daily support underlined on the chart should be watched closely. On the other hand, a break above 29,057 may resume bullish price action towards 29,719. Yet, the upper line of the upward channel should be kept in focus.
Having trouble with your trading strategy? Here’s the #1 Mistake That Traders Make
Written By: Mahmoud Alkudsi
Please feel free to contact me on Twitter: @Malkudsi