
ASX 200, NIKKEI 225 Technical ANALYSIS – TALKING POINTS:
- ASX 200 recoils from record high to suffer the worst decline in 11 years
- Nikkei 225 already on the precipice of breaking structural rising trend
- Both stock indexes flirt with piercing the bounds of post-crisis recovery
Coronavirus outbreak fears delivered the worst week since September 2008 – the heart of the global financial crisis – for Australia’s benchmark ASX 200 stock index. It plunged from a record high to erase six months of gains in just five days, landing at support-turned-resistance in the 6358-96 area.
Breaking below that initially exposes an inflection level at 6150, with the psychologically significant 6000 handle eyed thereafter. These are relatively minor barriers however. Prices have stalled in their vicinity before, but they have not shown a capacity to force lasting directional change.
This suggests that sellers may have scope to challenge structural support establishing the 11-year post-crisis recovery if current support has been conclusively overcome. Confirmation on that score will probably have to be secured on a closing basis to make for a compelling setup.

ASX 200 weekly chart created using TradingView
Japan’s Nikkei 225 stock index appears to be in an even more precarious position. Its recent selloff – marking the worst week in four years – has already brought it to the outer layer of its post-crisis trend support (Japanese shares idled after global markets bottomed in March 2009, waiting until late 2012 to rally in earnest).
Breaking lower from here – again, with confirmation on a closing basis – might set the stage for truly tectonic liquidation. Recovering above the 22505-630 support-turned-resistance area seems to be a prerequisite for neutralizing near-term selling pressure.
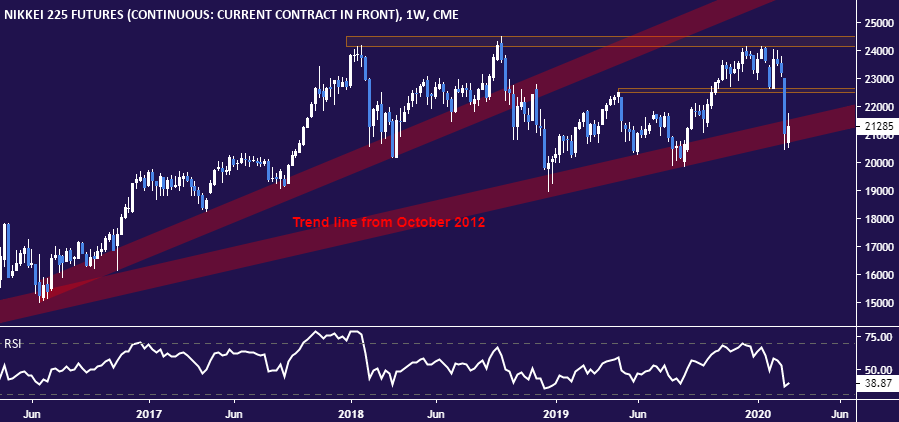
Nikkei 225 weekly chart created using TradingView
ASX 200, NIKKEI 225 TRADING RESOURCES:
- Just getting started? See our beginners’ guide for traders
- Having trouble with your strategy? Here’s the #1 mistake that traders make
- Join a free live webinar and have your trading questions answered
--- Written by Ilya Spivak, Currency Strategist for DailyFX.com
To contact Ilya, use the Comments section below or @IlyaSpivak on Twitter