


Technical Outlook:
- US Dollar Index (DXY) broke the 2-month range
- USD/JPY bottled up but ready to move
- Gold postured well, waiting for it to show momentum
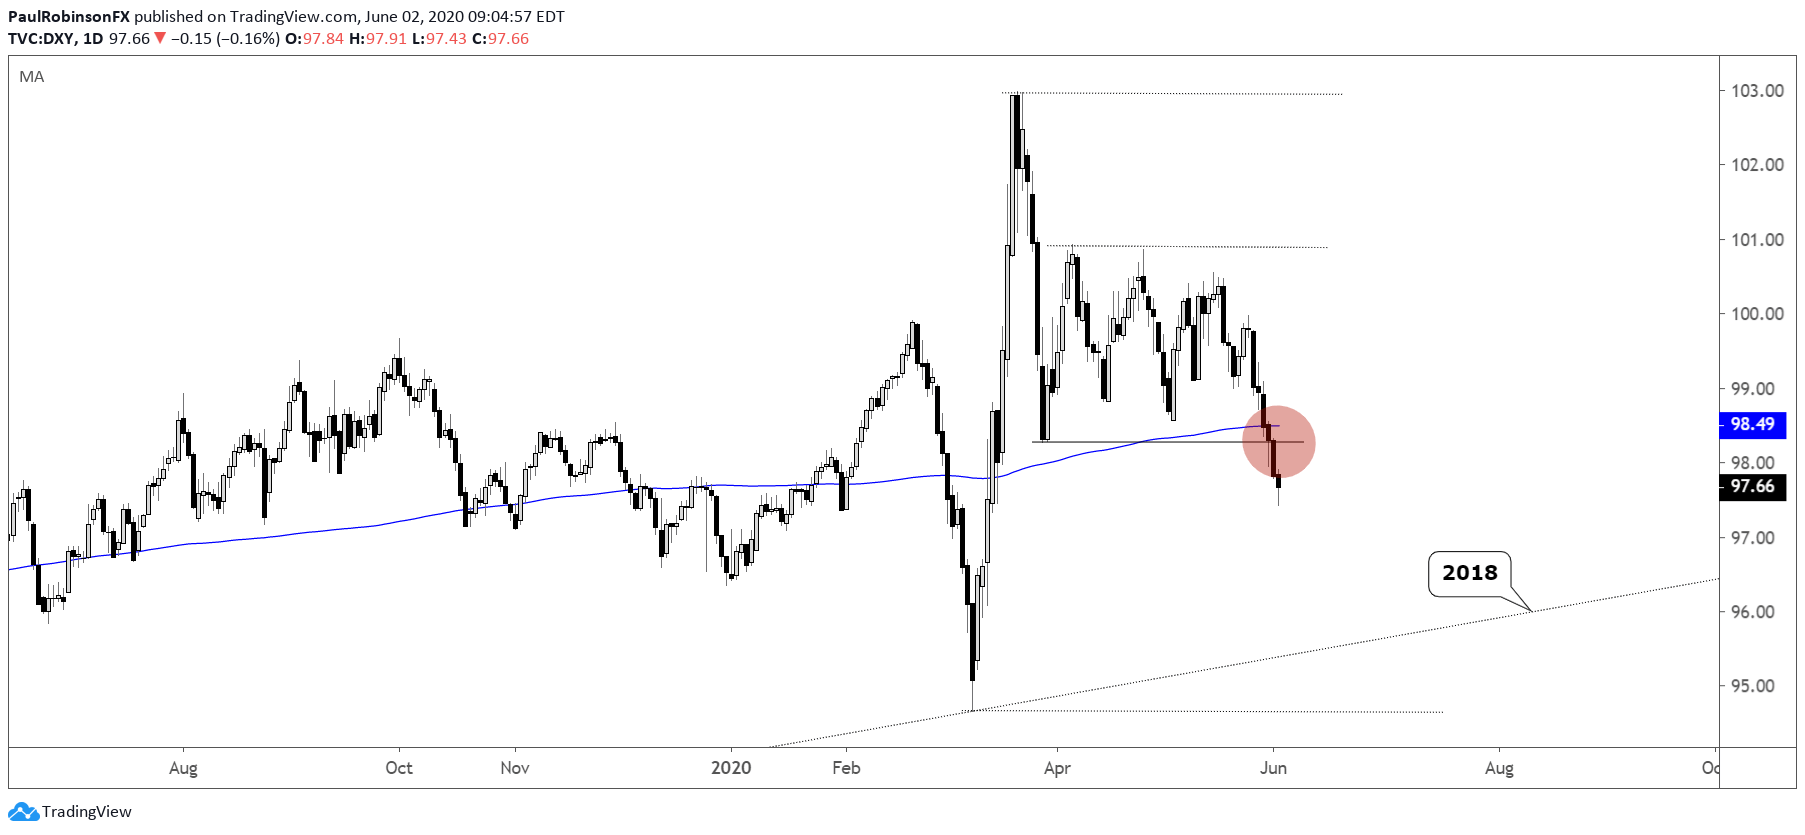
The US Dollar Index (DXY) finally broke the range it had been stuck in for two months. The breakdown comes with most currencies participating (sans JPY). The Euro of course has been a big driver as it accounts for 57% of the index’s weighting. As for where it could go now that it is outside of the range, the trend-line from the 2018 low in the mid-95s and lows from March under 95 are reasonable targets in the near-term. Should the DXY close back above 98.50 reclaiming the bottom of the range and the 200-day, then this down-move may prove to be false and we will at the least move a neutral stance.

US Dollar Index (DXY) Daily Chart (range-break)
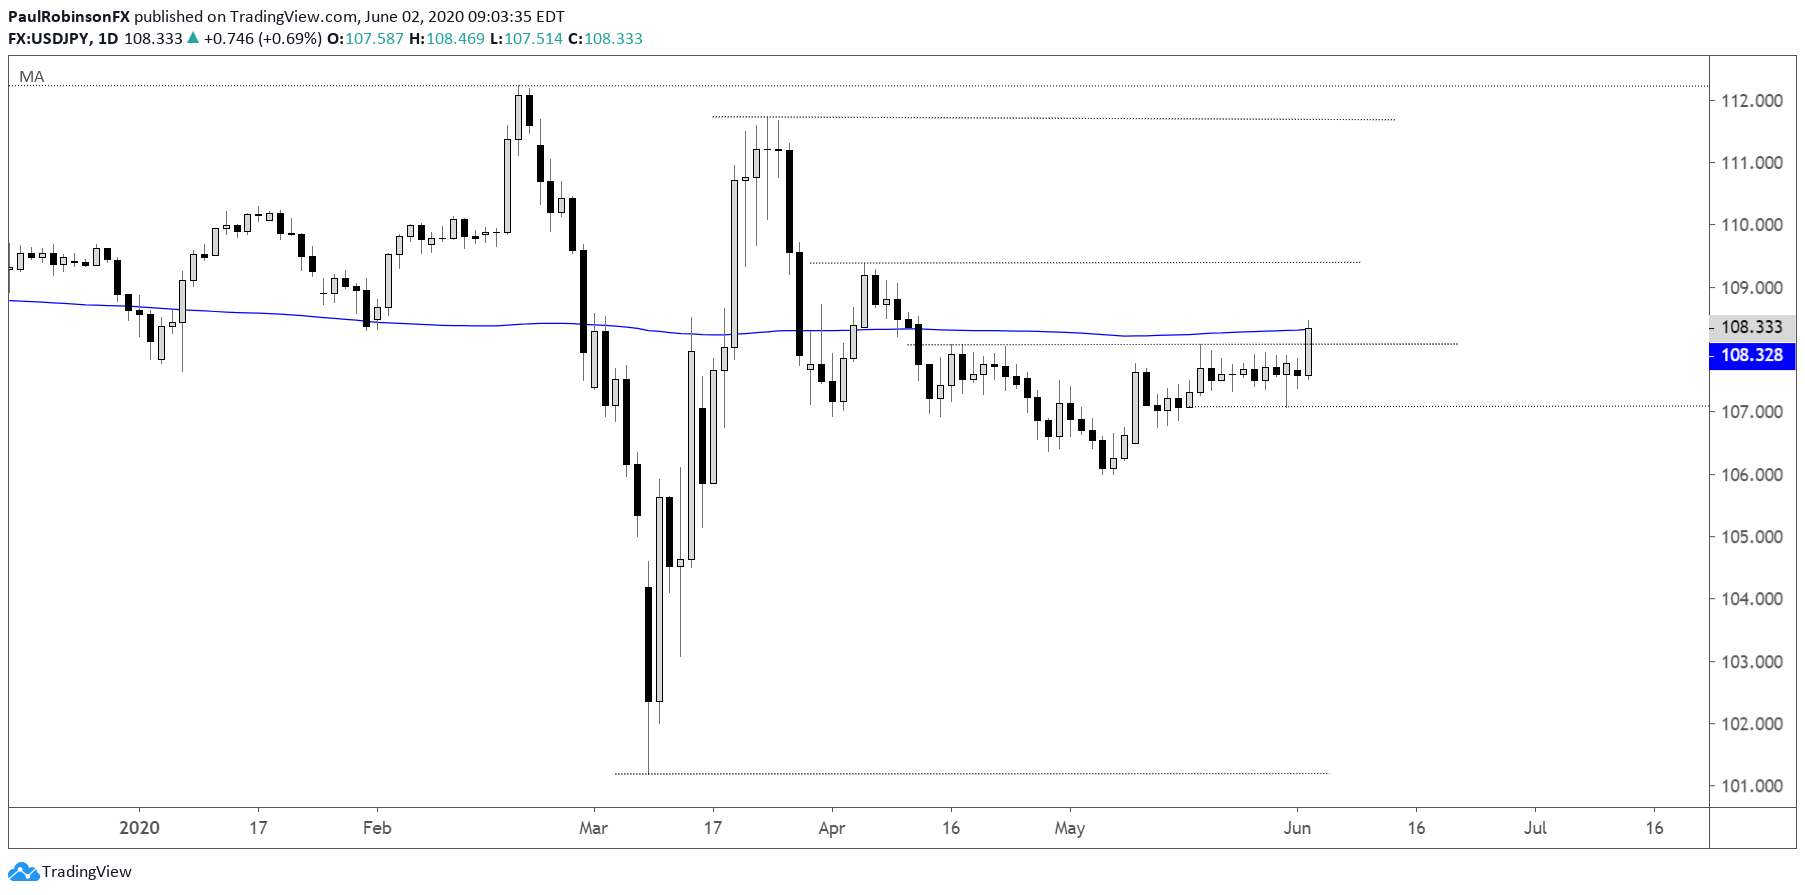
USD/JPY has been a mystery as it has moved basically nowhere of recent despite other USD pairs making sizable moves. That should change soon as periods of extreme quiet give-way to periods of activity. A breakout above 10840 will have recent highs taken out along with the 200-day, this could set USD/JPY up to rally nicely, while a breakdown below 10707 could do the trick for getting sellers interested in hitting the bids. In either event, we should be ready for a move.
USD/JPY Daily Chart (narrow range to break soon)
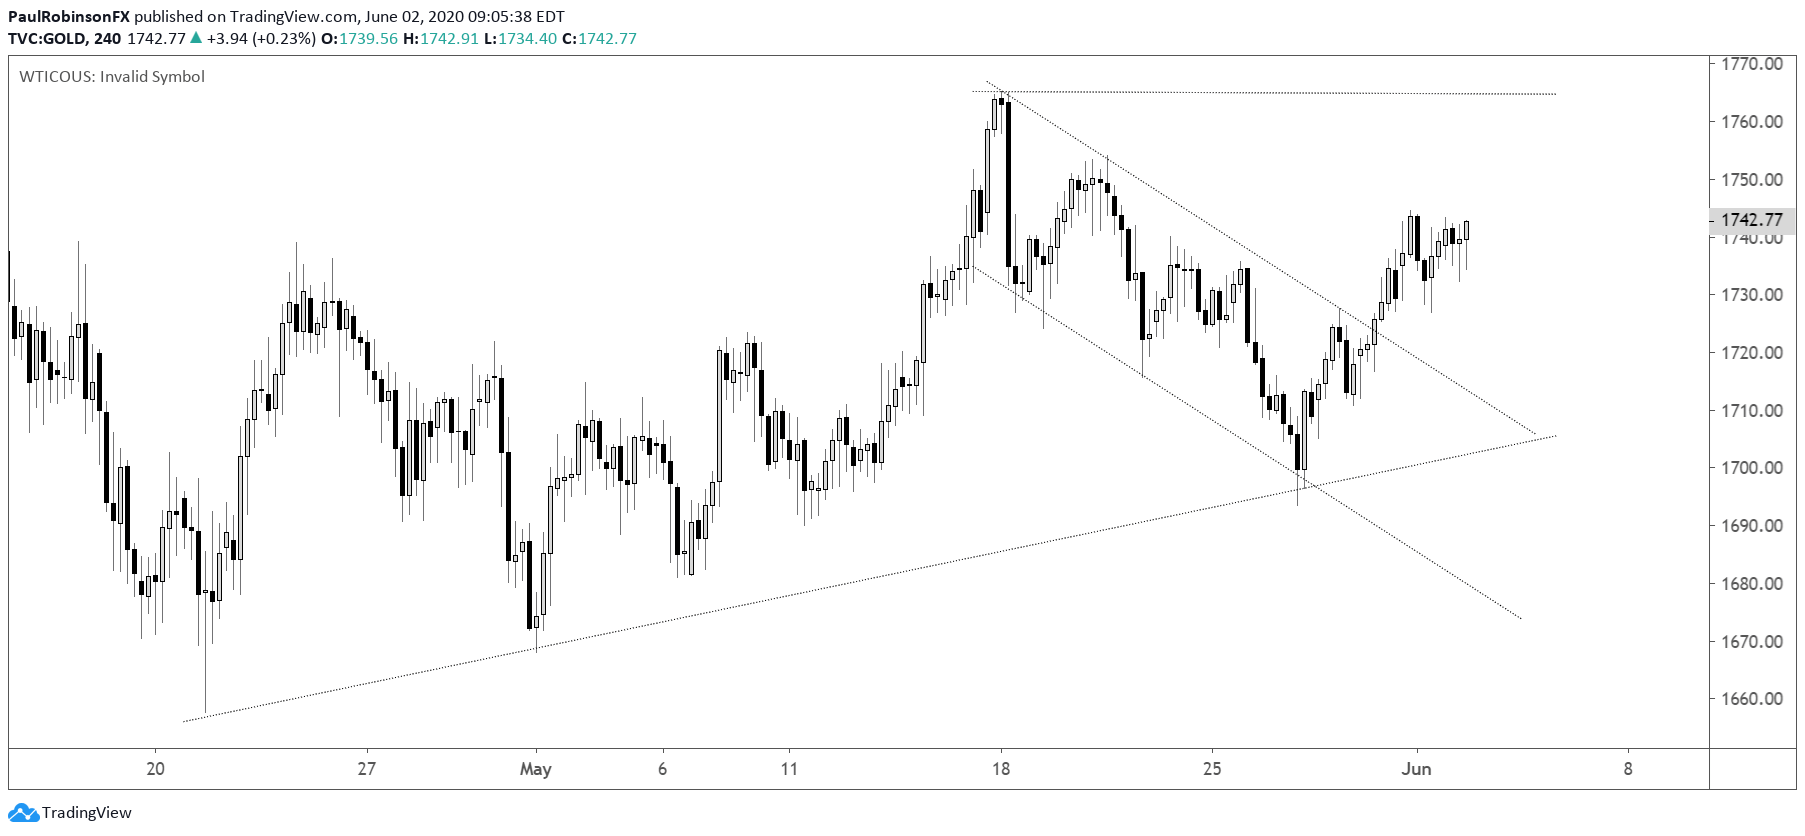
Gold has been coming out of a channel and acting well, but some momentum here shortly would be a good sign given it has USD as a tailwind. A breakout above 1765 should spark more buying interest up towards the 1800-area where several tops from 2011/12 sit. At that juncture we would need to reassess as pullback risk would be high. Staying bullish unless we see strong negative price action.

Gold 4-hr Chart (sitting bullish still, watch 1765)
Gold Price Chart by TradingView
Resources for Forex Traders
Whether you are a new or an experienced trader, DailyFX has several resources available to help you; indicator for tracking trader sentiment, quarterly trading forecasts, analytical and educational webinars held daily, and trading guides to help you improve trading performance.
---Written by Paul Robinson, Market Analyst
You can follow Paul on Twitter at @PaulRobinsonFX


