
ZAR TALKING POINTS:
- South African Rand continues to show strength as last week’s gains are sustained
- ZAR crosses holding at key levels of support
- South African Balance of Trade and PMI data due this week
- Global market PMI’s and Non-Farm Payrolls (NFP)
SOUTH AFRICAN RAND STRENGTH LINGERS FOR NOW
Last week the Rand has remained resolute against majors with global ‘risk on’ sentiment as well as South African CPI figures which saw inflation well within the South African Reserve Bank’s (SARB) target range. Despite a respectable week from the Euro and Pound, market participants favored Emerging Market (EM) currencies.
Visit the DailyFX Educational Center to discover more on why news events are essential to FX fundamental analysis
ZAR TECHNICAL ANALYSIS
Another dismal week for the US Dollar helped keep the ZAR wading through the 23.6% Fibonacci and 38.2% Fibonacci levels respectively (February 2018 low to April 2020 high). The 16.5000 psychological level (blue) is not far away as mentioned in my previous article on ZAR price action setups. 16.3444 (38.2% Fibonacci) may be the next major level of support, which if broken, may further downward momentum to 16.0000.
Alternatively, price may use 16.3444 as a springboard to rise back towards the upper end of the range at the 23.6% Fibonacci level.
USD/ZAR: Daily Chart
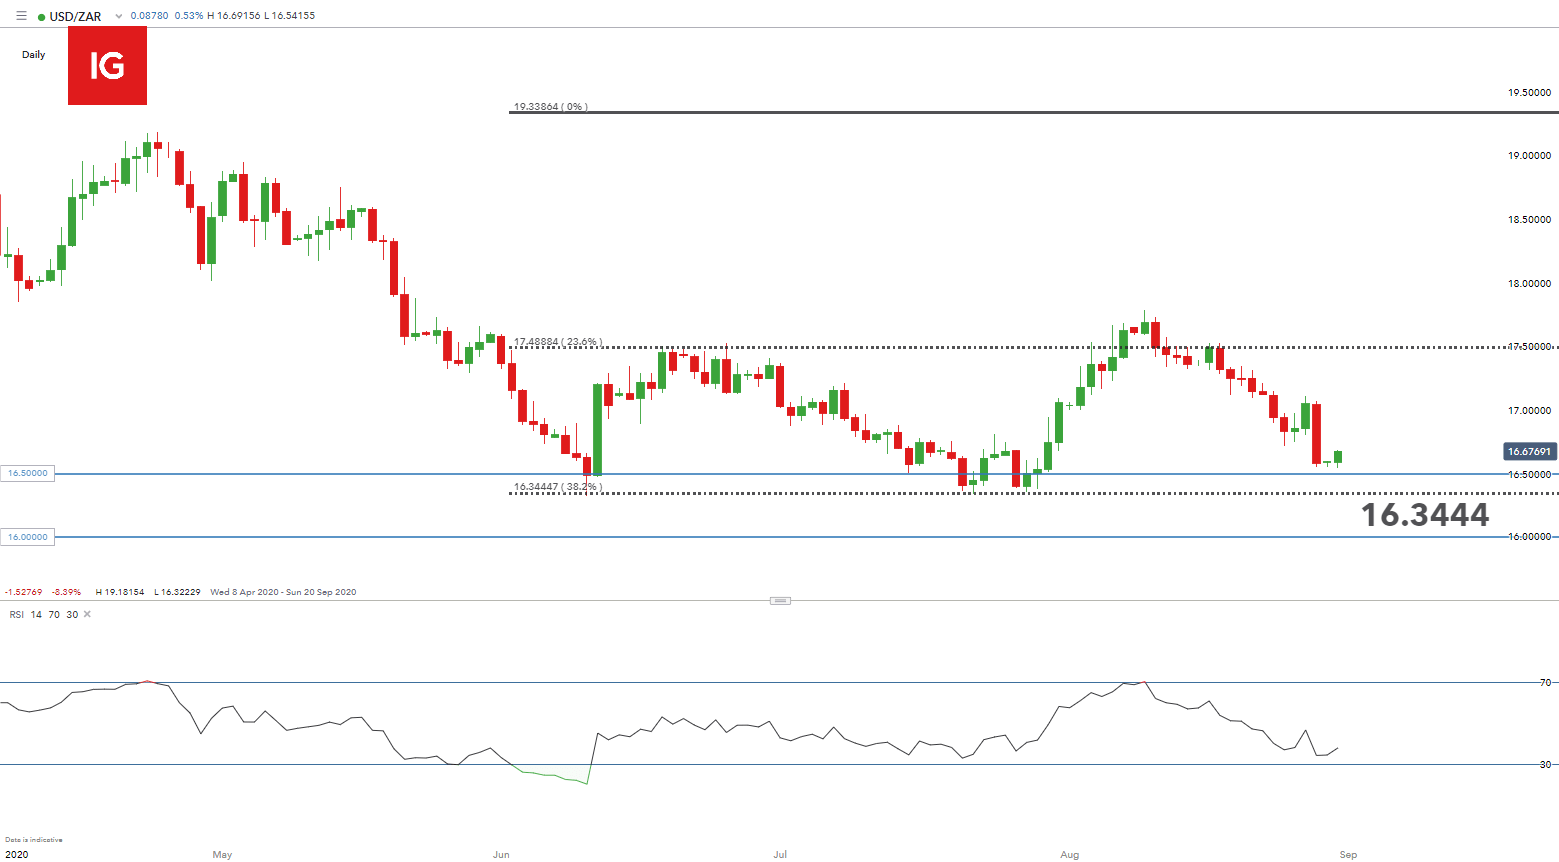
Chart prepared by Warren Venketas, IG
GBP/ZAR: Daily Chart
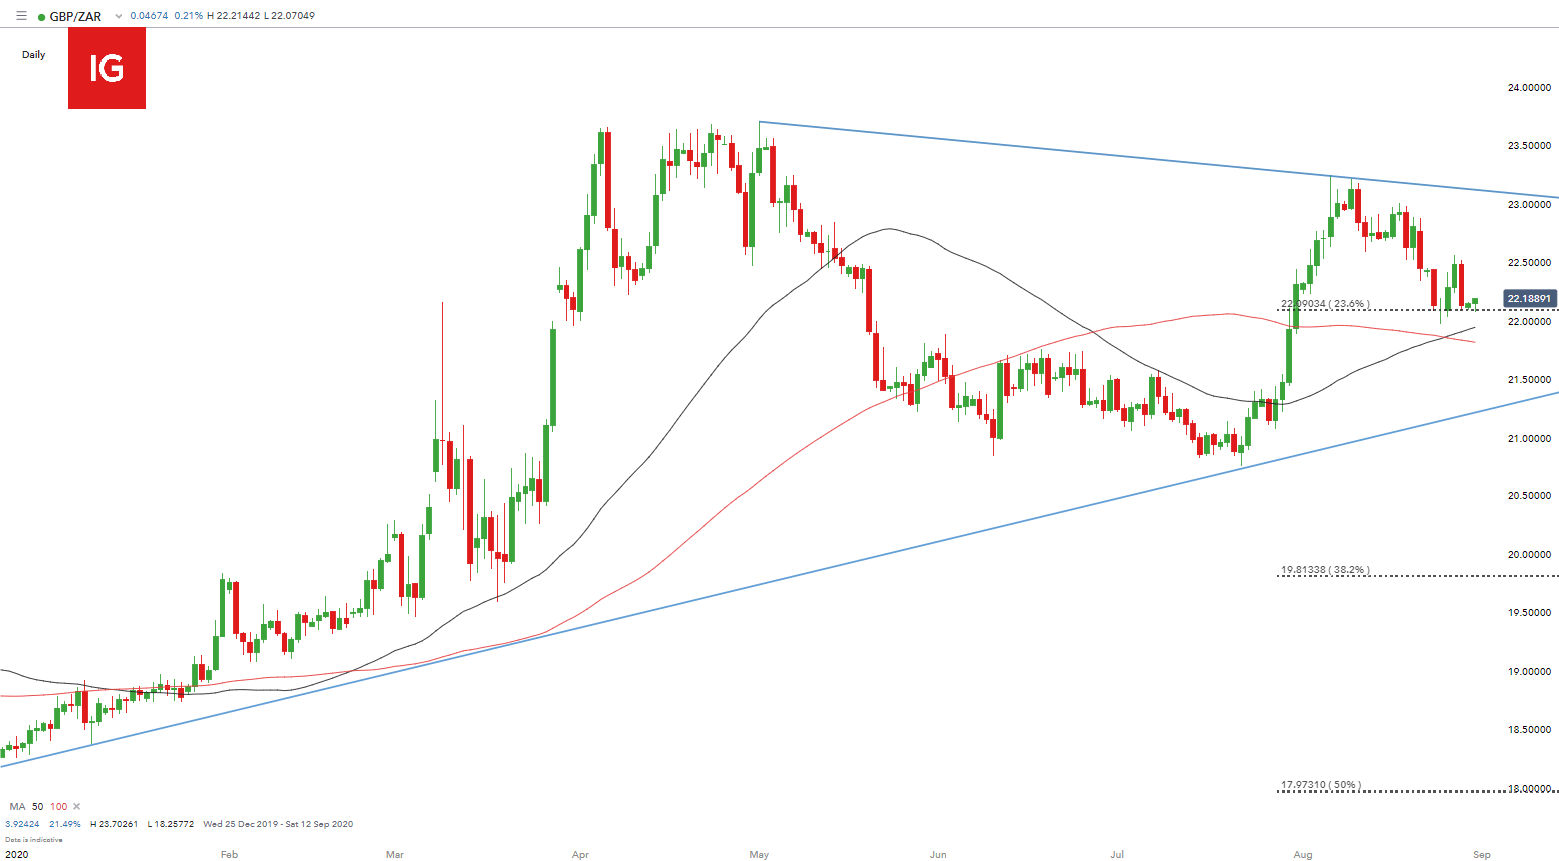
Chart prepared by Warren Venketas, IG
GBP/ZAR is pulling back towards confluent support consisting of the 23.6% Fibonacci and recent bullish crossover of the 50-day (black) and 100-day (red) Moving Average (MA). The 23.6% Fibonacci has been a key level of support and traders will want to keep a close eye on a break below or a push off towards trendline resistance on the multi-month triangle (blue).
Keep up to date with your indicators via our Technical Indicator Toolbox

EUR/ZAR: Daily Chart
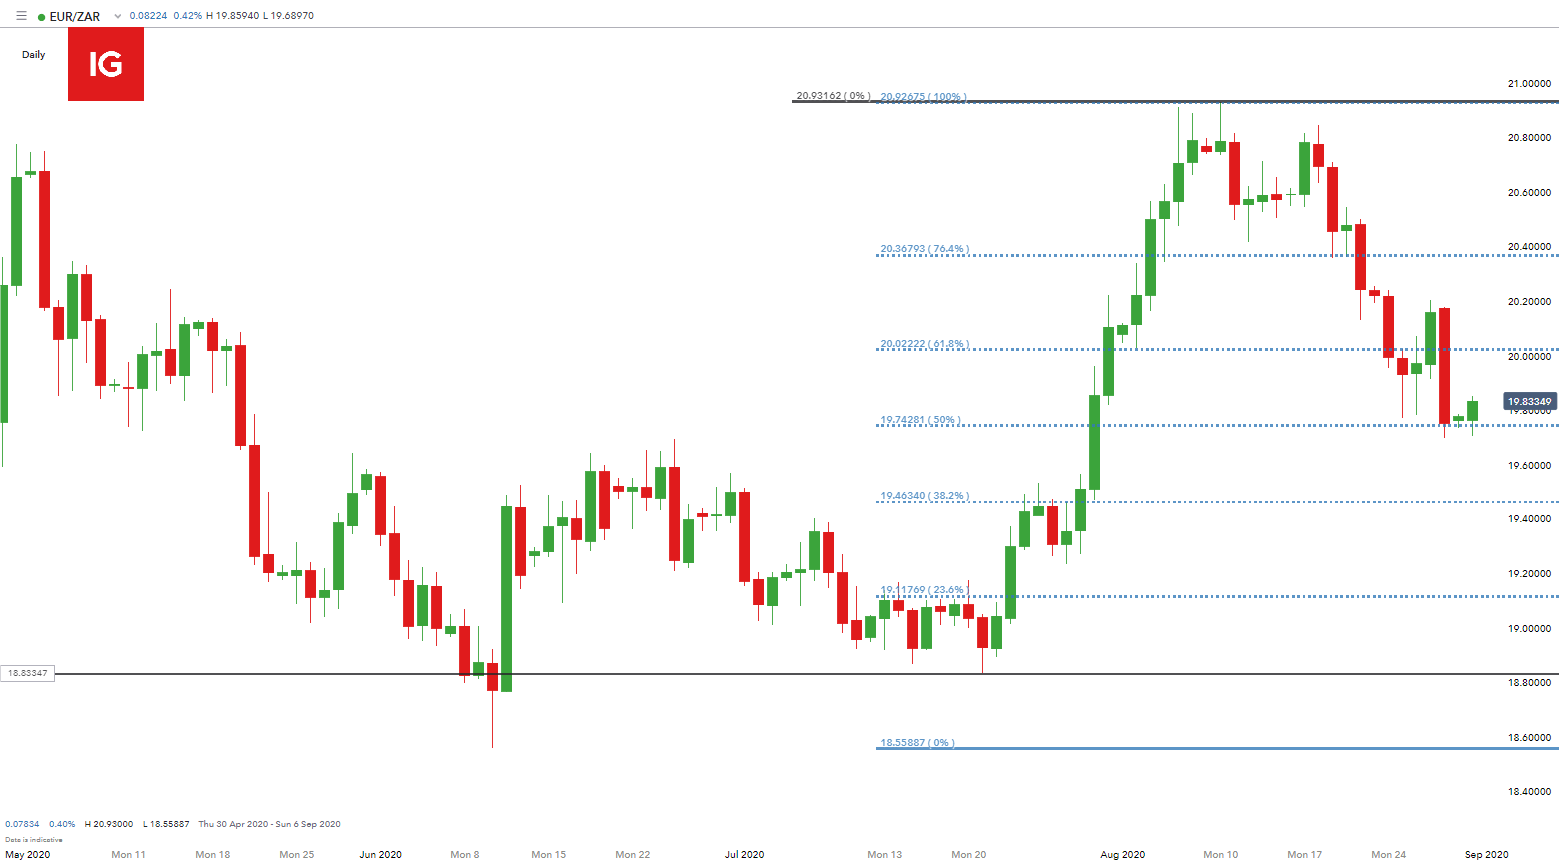
Chart prepared by Warren Venketas, IG
EUR/ZAR mirrors a similar setup to both the USD/ZAR and GBP/ZAR crosses. Last week saw a break below the 61.8% Fibonacci (20.0222) and price is currently hold at the 50% Fibonacci (19.7428). The pair is likely waiting for a catalyst to provide the Rand with a directional bias.
ECONOMIC DATA MAY PROVIDE THE CATALYST NEEDED FOR FURTHER GUIDANCE

Rand traders have a lot to look out for later today and tomorrow with the Balance of Trade figures out at 14:00 (GMT+2) and ABSA Manufacturing PMI 11:00 (GMT+2). Both will likely have an impact on ZAR price action. Any significant deviation from estimates may result in large price swings. It will be interesting to see whether recent ZAR strength will have any influence on import and export data.

Global markets will also provide key PMI data throughout the week with the US and China. China has already missed expectations which was immediately echoed in greenback strength. If US PMI data is in line or better than expectation, the US Dollar could further it’s near term strength. Non-Farm Payrolls (NFP) on Friday have been unpredictable to say the least with large variations from expectant figures. How will the upcoming NFP figures compare?
ZAR STRATEGY MOVING FORWARD
The ZAR has shown resilience since August but will upcoming economic data put a halt to Rand bulls? The South African currency is heavily reflective of global market sentiment which is constantly in a state of change especially in the current economic climate, so traders will need to monitor global risk events for potential momentum shifts.
Key trading points to consider:
- Technical analysis – USD/ZAR: 16.3444 (38.2% Fibonacci level); GBP/ZAR: MA crossover to extend bullish move; EUR/ZAR: 19.7428 Fibonacci level
- Local Balance of Trade and PMI data
- Global PMI’s and NFP data
--- Written by Warren Venketas for DailyFX.com
Contact and follow Warren on Twitter: @WVenketas