


Indian Rupee, USD/INR, Nifty 50, Technical Analysis - Talking Points
- Indian Rupee may regain momentum against the US Dollar
- USD/INR rejected a push above a former rising trend line
- Nifty 50 at risk to losses after closing under a falling wedge
Indian Rupee Technical Analysis
The US Dollar is attempting to regain lost ground against the Indian Rupee, but the focus could be reinstated to the downside ahead. USD/INR broke under key rising support from July 2019 in late August, opening the door to extending losses. However, prices were unable to get far, establishing new support between 72.76 and 73.00. Now, former rising support seems to have established itself as new resistance. That is because prices attempted to push back above the trend line before falling back under it.
This could open the door to retesting the 72.76 – 73.00 zone. Closing under this area would then expose an area of resistance that held throughout the last few months of 2019. This could make for a new area of support between 72.14 and 72.40. Taking out this zone risks extending losses as prices aim for late-2019 lows between 70.35 and 70.54. Otherwise, further gains from here would shift the focus to the 61.8% and the midpoint of the Fibonacci extension drawn on the chart below.
USD/INR Daily Chart
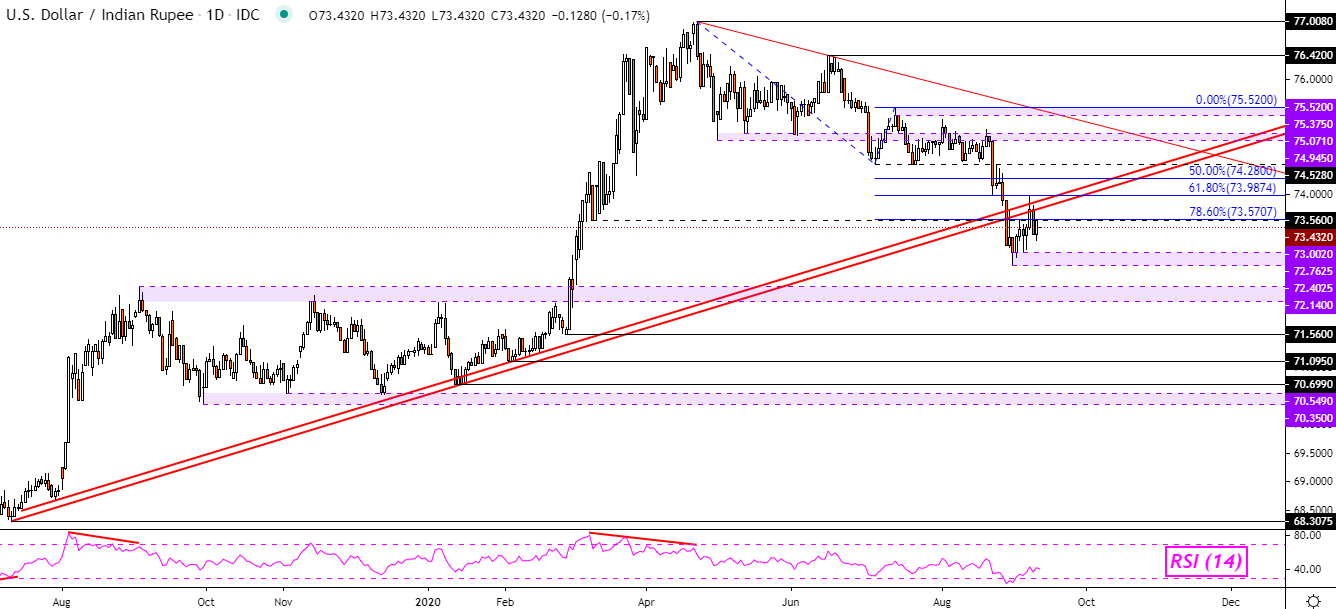
USD/INR Chart Created in TradingView
Nifty 50 Technical Analysis
India’s benchmark stock index, the Nifty 50, may be at risk of deeper losses. This is because it broke under a bearish Rising Wedge chart pattern and has since seen some confirmation. This also followed the presence of negative RSI divergence, indicating fading upside momentum. Since then, the Nifty attempted to push under the 11433 – 11317 inflection zone.
However, bulls managed to regain some traction, denying a confirmatory breakout lower. Another attempt lower could raise the risk of a deeper reversal in the Nifty 50. That would place the focus on support below at 11111 followed by 10894 on the way towards 10553. Otherwise, uptrend resumption entails closing above 11802 as the index attempts to make its way back to the current all-time high at 12430.
Discover your trading personality to help find optimal forms of analyzing financial markets
Nifty 50 Daily Chart

Nifty 50 Chart Created in TradingView
--- Written by Daniel Dubrovsky, Currency Analyst for DailyFX.com
To contact Daniel, use the comments section below or @ddubrovskyFX on Twitter


