


US Dollar, USD/SGD, USD/THB, USD/PHP, USD/IDR – ASEAN Technical Analysis
- US Dollar remains vulnerable to ASEAN currencies ahead
- USD/SGD Double Top in play? USD/THB downtrend extends
- USD/PHP Double Top still brewing, USD/IDR breaks support

Singapore Dollar Technical Outlook
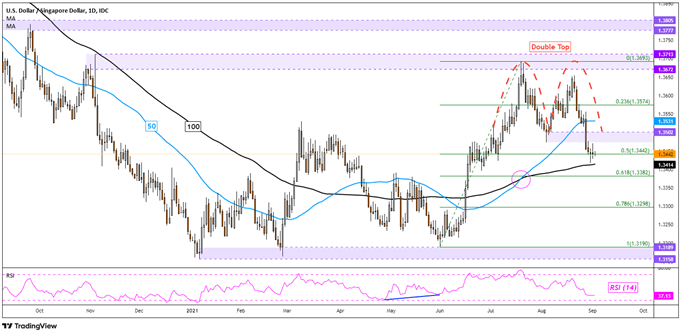
The US Dollar may be increasingly vulnerable to the Singapore Dollar after USD/SGD broke under the floor of a bearish Double Top chart formation. That has opened the door to extending the near-term downtrend towards lows from June. Prices also took out the 50-day Simple Moving Average (SMA), but the 100-day line has held. The latter could still maintain the dominant focus to the upside since June. Otherwise, clearing the line may increase the odds of extending the downtrend.
USD/SGD Daily Chart
Thai Baht Technical Outlook
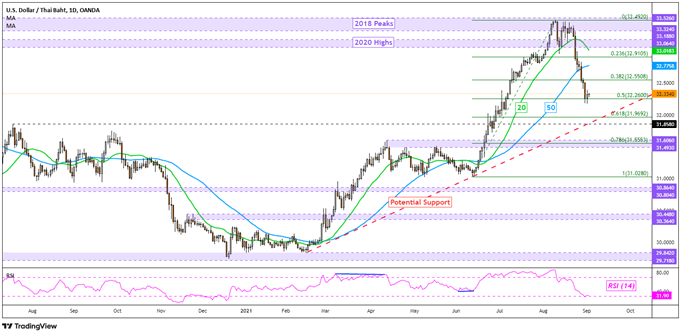
The US Dollar is losing material ground to the Thai Baht. August was the worst month for USD/THB since November 2020, with last week’s 2.45% drop being the most aggressive 5-day decline since July 2018. Prices have taken out both the 20- and 50-day SMAs. That has exposed a potential rising trendline from February. Further losses may see the pair decline towards that line. If it is confirmed, the pair may pivot higher, resuming the dominant uptrend since earlier this year.

USD/THB Daily Chart
Philippine Peso Technical Outlook
The US Dollar is facing its next key test against the Philippine Peso. USD/PHP was recently unable to pierce the floor of a bearish Double Top chart pattern. This makes for a key zone of support between 49.67 and 49.84. Turning lower to retest the zone, and subsequently clearing it could open the door to a material turn lower. Such an outcome may place the focus on the 100-day SMA. Otherwise, extending a bounce off the neckline may see the pair revisit the August high.

USD/PHP Daily Chart
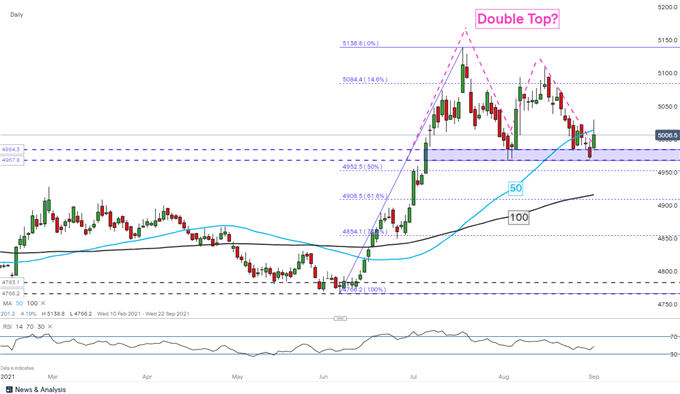
Chart Created on the IG Trading Platform
Indonesian Rupiah Technical Outlook
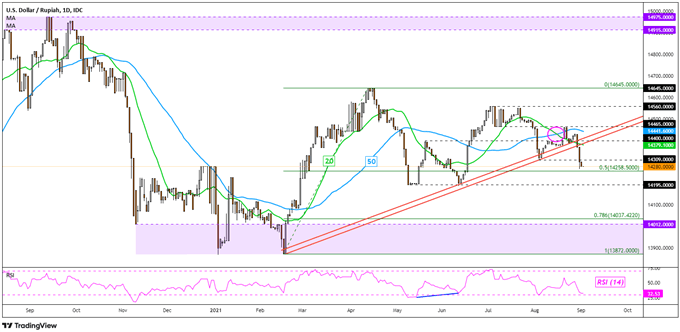
The US Dollar is also looking vulnerable to the Indonesian Rupiah. USD/IDR confirmed a breakout under rising support from February. Meanwhile, a bearish ‘Death Cross’ emerged between the 20- and 50-day SMAs, underscoring a near-term downward bias. Immediate support seems to be the midpoint of the Fibonacci extension at 14258, with the May low just under at 14195. Falling under the latter exposes current 2021 lows. In the event of a turn higher, keep a close eye on the SMAs, which may act as new resistance.
USD/IDR Daily Chart
--- Written by Daniel Dubrovsky, Strategist for DailyFX.com
To contact Daniel, use the comments section below or @ddubrovskyFX on Twitter


