

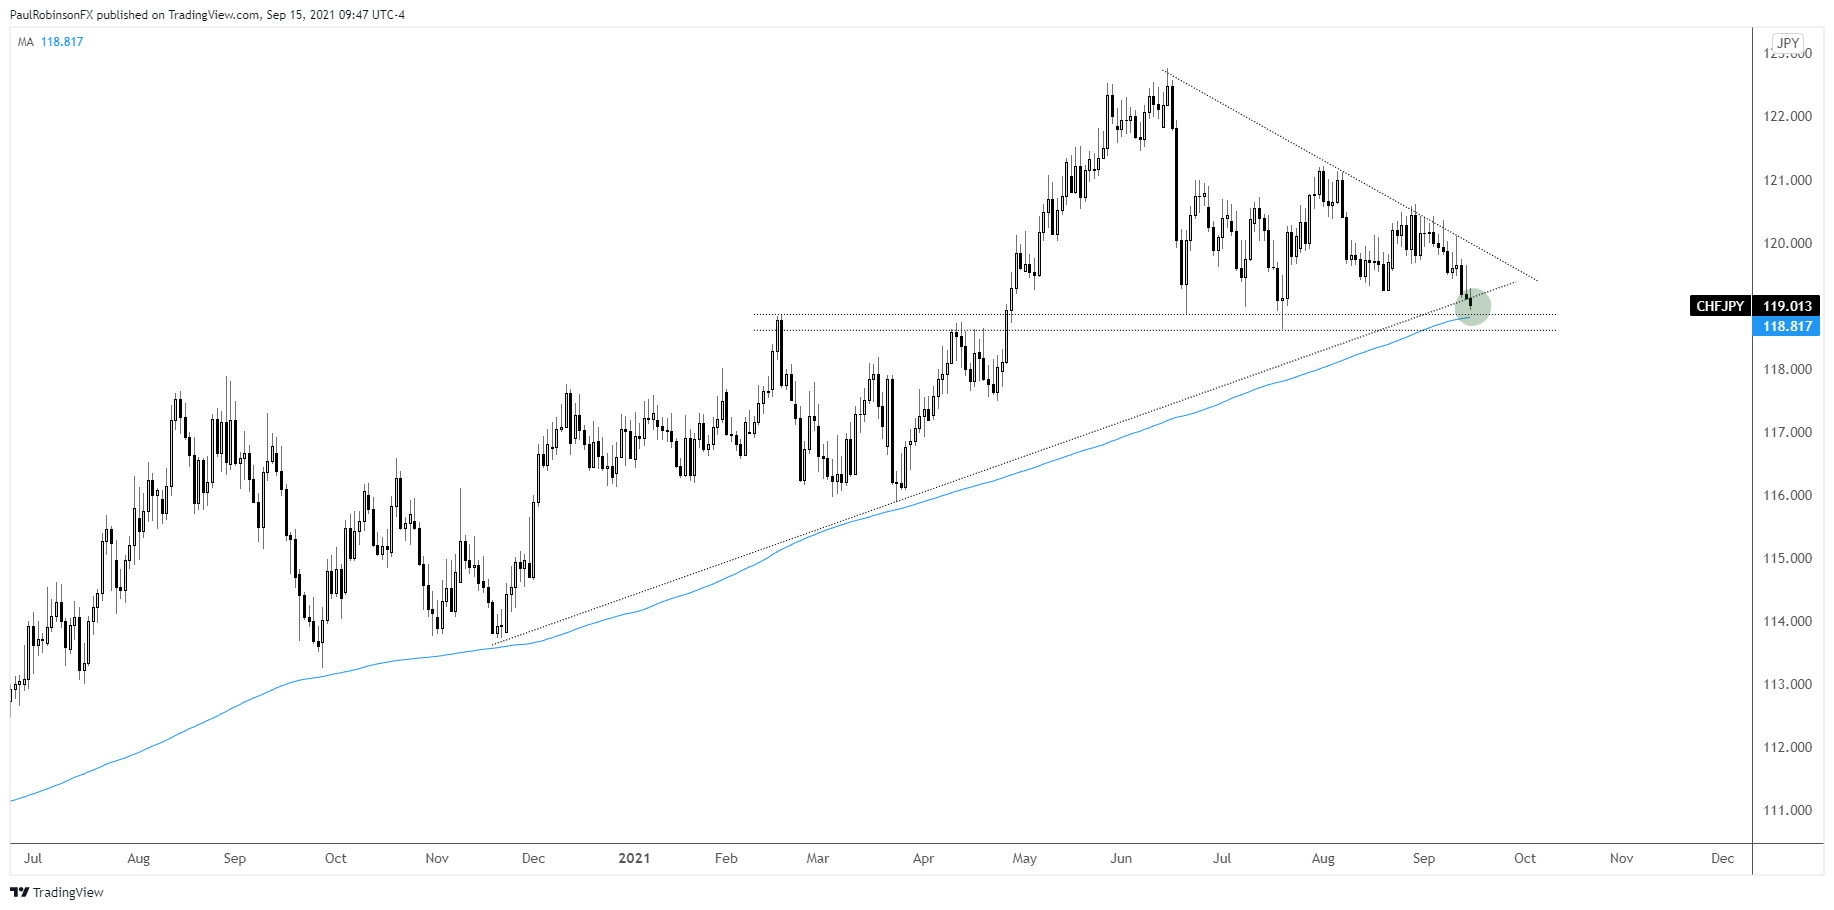
CHF/JPY is declining into an important area of confluent support via a trend-line from November, horizontal support dating to February, and then finally the 200-day moving average that is at nearly the same slope as the Nov trend-line.
Over the past three months we are seeing lower highs that when coupled with horizontal support is forming a descending wedge with a solid-looking floor. Support is support until broken, but if we see a daily close below 118.65, then look for a bearish trading bias to increase.
Hold onto support, then an eventual break of the top-side trend-line of the wedge pattern could unfold. This would then significantly strengthen a bullish trading bias.
For now, waiting to see how price action develops around support before drawing any further conclusions. We should soon have something more concrete to work with.
Please see the video above for the full details…
CHF/JPY Daily Chart
Resources for Forex Traders
Whether you are a new or experienced trader, we have several resources available to help you; indicator for tracking trader sentiment, quarterly trading forecasts, analytical and educational webinars held daily, trading guides to help you improve trading performance, and one specifically for those who are new to forex.
---Written by Paul Robinson, Market Analyst
You can follow Paul on Twitter at @PaulRobinsonFX