
ARKK KEY POINTS:
- ARKK has been developing a double-top pattern since the second half of July
- The double-top formation has bearish connotations for the underlying asset from a technical standpoint
- The prospect of less monetary stimulus in the US as the Fed prepares to normalize policy is also negative for this growth-oriented ETF
Trade Smarter - Sign up for the DailyFX Newsletter
Receive timely and compelling market commentary from the DailyFX team
Most read: US Dollar Price Action Post-Fed: S&P 500, USD, EUR/USD
ARKK Innovation (ARKK), the EFT created by Cathie Wood that epitomizes disruptive growth investing, has trended downwards since Sept. 7 after failing to clear resistance in the 126.50 area. During that time, the actively managed fund has retreated more than 5%, despite a small bounce on Wednesday amid a broad-based rally in risk assets.
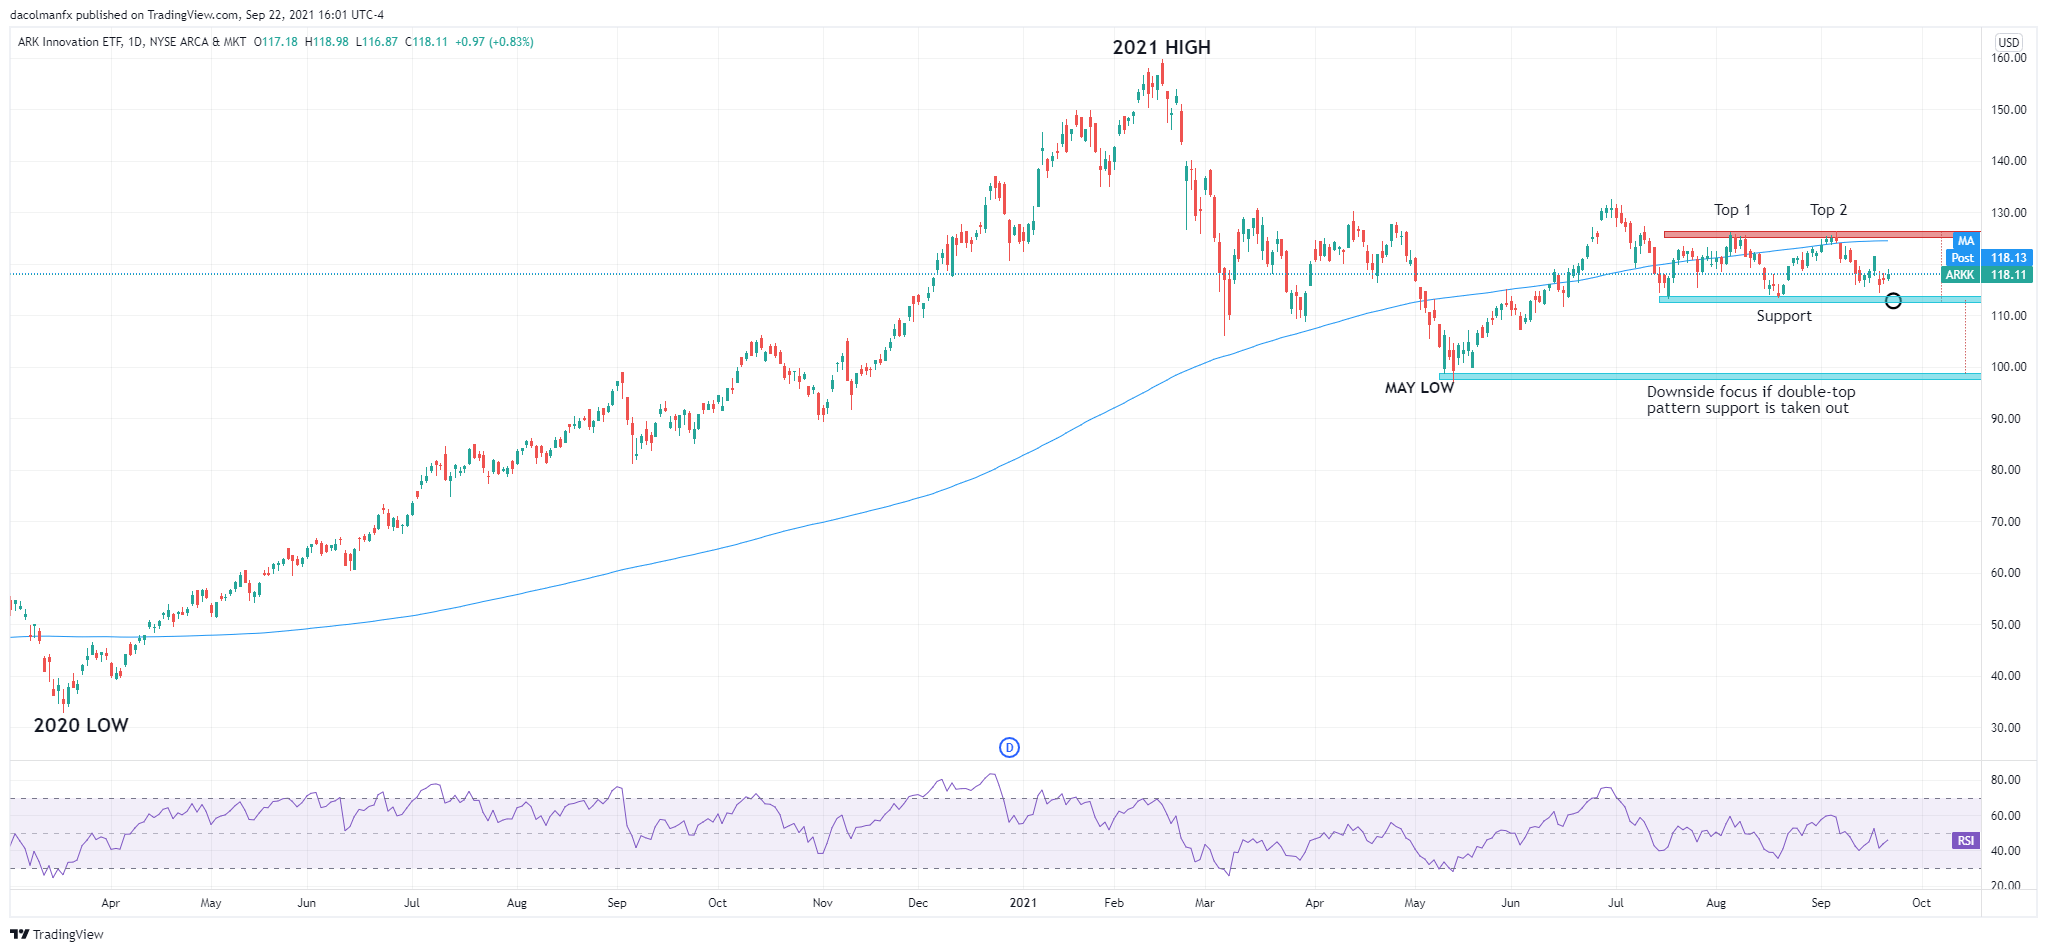
Following recent price action, ARKK appears to be developing the last leg of a double-top pattern, in play since the second half of July. This technical formation, which resembles the capital letter M, has bearish connotations and is confirmed once price pulls back from the second peak and breaks the low of the intermediate trough dividing both tops, a critical support area. In this case, this level is located at ~113.00.
From a strictly technical standpoint, a move below 113 can be ominous, as it can attract sellers and trigger an outsize retracement. That said, if the 113 floor is decisively breached on a daily closing basis, the May low near the 98/97 area would become the immediate downside focus. For reference, this area of interest is obtained by projecting the approximate height of the double top pattern from the breakout point.
Fundamental analysis appears to support the bearish theory, as tighter US monetary policy over the forecast horizon may create headwinds for high-flying stocks. Related to the latter point, the Federal Reserve released its September interest rate decision today. While the FOMC kept borrowing costs unchanged, it indicated that a reduction in the pace of asset purchases may soon be warranted and signaled, via its dot plot, that liftoff could begin in 2022 rather than 2023 as had been anticipated at the June meeting.
As the Fed prepares to normalize policy, Treasury yields are likely to rise over the medium term. As for the 10-year U.S. bond yield, estimates vary, but the general consensus is that the benchmark rate could end the year near or above 1.60%, about 30 basis points from current levels.
Broadly speaking, when yields rise, companies’ future earnings are worth less in present when discounting them at a higher rate. This can be detrimental to growth stocks with frothy valuations and longer duration cash flows. Most of the companies in the ARKK innovation portfolio meet this criteria.

ARKK TECHNICAL ANALYSIS CHART
EDUCATION TOOLS FOR TRADERS
- Are you just getting started? Download our beginners’ guide for FX traders
- Would you like to know more about your trading personality? Take our quiz and find out
- IG's client positioning data provides valuable information on market sentiment. Get your free guide on how to use this powerful trading indicator here.
- Subscribe to the DailyFX Newsletter for weekly market updates and insightful analysis
---Written by Diego Colman, DailyFX Market Strategist