
S&P 500, Dow Jones, Technical Analysis, Retail Trader Positioning - Talking Points
- Retail traders continue to broadly sell the S&P 500 and Dow Jones
- Since the majority of them are net-short, prices may keep climbing
- Shooting Star candlesticks in them hint to watch for follow-through

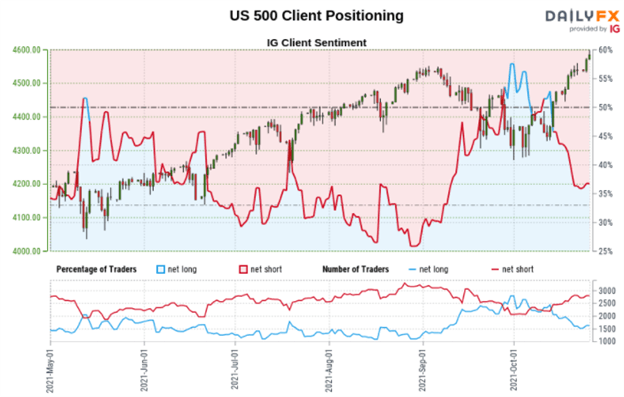
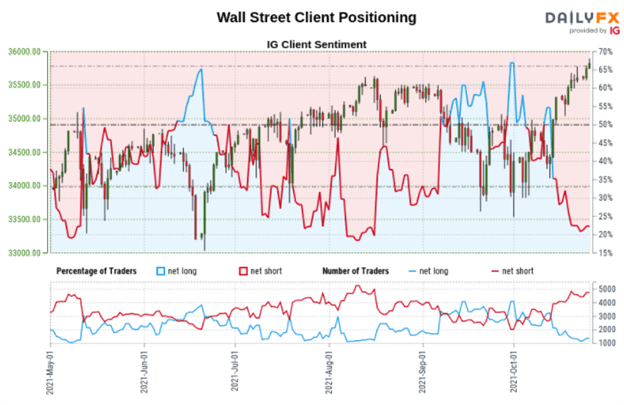
Looking at IG Client Sentiment (IGCS), retail traders are continuing to sell the major benchmark stock indices on Wall Street such as the S&P 500 and Dow Jones. IGCS can at times be a contrarian indicator. If investors keep selling into recent price action, these indices could continue rising. To learn more about how can you use this tool in your own strategy, check out the recording of my webinar above.
S&P 500 Sentiment Outlook - Bullish
The IGCS gauge shows that roughly 38% of retail trader are net-long the S&P 500. Upside exposure is on the decline, falling by 6.18% and 21.20% over a daily and weekly basis respectively. Since the majority of traders are net-short, the data suggests that prices may continue rising. Recent changes in positioning are further underscoring a bullish-contrarian trading bias.

Technical Analysis
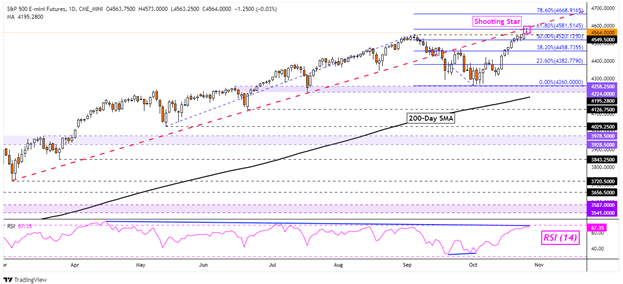
On the daily chart, S&P 500 futures have left behind a Shooting Star candlestick pattern. While this may hint at a turn lower, confirmation could be key. Further downside progress from here could hint at a broader descent. Clearing the midpoint of the Fibonacci extension at 4520 exposes the 38.2% level at 4458. Under that is the key 4258 – 4224 inflection zone. On the other hand, extending gains into new record highs has the 78.6% level in sight at 4668.
S&P 500 Futures Daily Chart
Dow Jones Sentiment Outlook - Mixed
The IGCS gauge implies that about 27% of retail traders are net-long the Dow Jones. Upside exposure increased by 12.76% over a daily basis, simultaneously decreasing by 16.92% compared to a week ago. Since the majority of retail traders are net-long, prices may continue rising. However, recent shifts in positioning are offering a mixed contrarian trading bias.
Technical Analysis
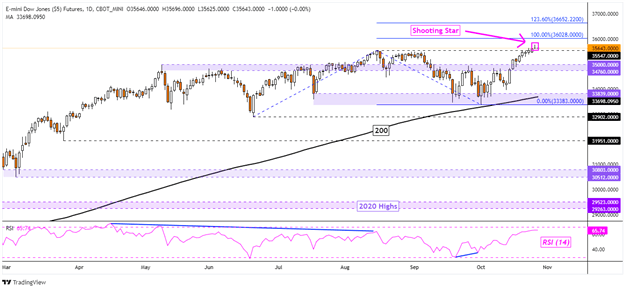
Dow Jones futures are facing a similar technical scenario as the S&P 500. The index left behind a Shooting Star candlestick. Still, confirmation is lacking. Subsequent downside closes from here may increase the risk of a turn lower. That may place the focus on the 34760 – 35000 inflection zone before exposing the 200-day Simple Moving Average. Otherwise, extending gains from here has the 100% Fibonacci extension in focus at 36028.
Dow Jones Futures Daily Chart
*IG Client Sentiment Charts and Positioning Data Used from October 26th Report
--- Written by Daniel Dubrovsky, Strategist for DailyFX.com
To contact Daniel, use the comments section below or @ddubrovskyFX on Twitter