

Japanese Yen, USD/JPY, US Dollar, AUD/JPY, Australian Dollar- Talking Points
- USD/JPY is staring at new highs and momentum may see it run up
- AUD/JPY momentum could assist technical indicators for the bulls
- The Yen weakening trend might be resuming, will USD/JPY go higher?
Introduction to Technical Analysis
Learn Technical Analysis
Recommended by Daniel McCarthy
USD/JPY
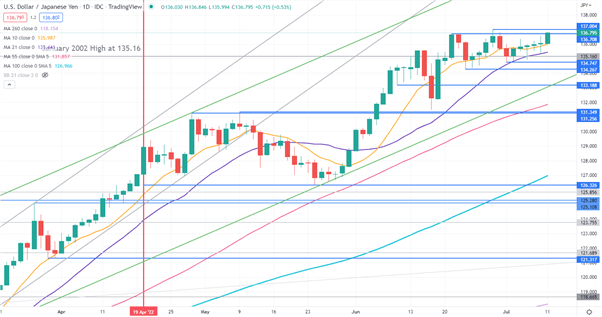
USD/JPY appears to be ready to test the 24-year high seen at the end of June as it remains in an ascending trend channel. It continues to make higher highs and higher lows.
The price has returned to be above the 10-day simple moving average (SMA) and bullish momentum may further unfold.
A bullish triple moving average (TMA) formation requires the price to be above the short term SMA, the latter to be above the medium term SMA and the medium term SMA to be above the long term SMA. All SMAs also need to have a positive gradient.
Looking at any three of the 10-, 21-, 55-, 100- and 260-day SMAs, the criteria for a TMA has been met.
Support might be provided at the recent lows of 134.75 and 134.27, or further below at a potential support zone of 131.25 - 131.35, where there are two break points.
An ascending trend line may also provide support, currently intersecting near 133.20, which is also near a break point. Running parallel to the trend line is the 55-day SMA that may also provide support, currently at 131.86.
The recent peak of 137.00 might offer resistance.

AUD/JPY
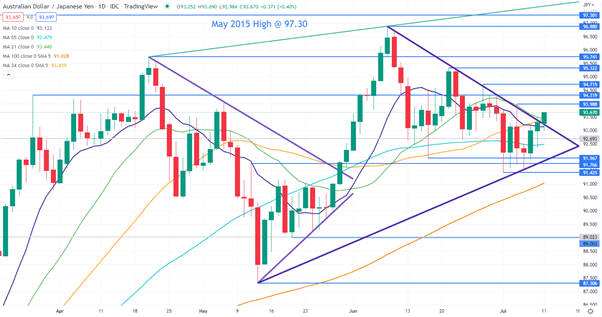
After breaking the topside of a Pennant Formation at the end of May, AUD/JPY went from under 92.00 to a 7-year high of 96.88.
A second Pennant Formation breakout could be occurring and a close above 93.50 might see bullishness unfold. That would also place the price above the 10-, 21- and 34-day simple moving averages (SMA), which may suggest that bullish momentum is evolving.
Resistance could be at the recent peaks of 93.99, 94.32, 94.72, 95.32 and 96.88.
On the downside, support may lie at the recent low of 91.42 or at an ascending trend line that currently dissects at 91.85.

--- Written by Daniel McCarthy, Strategist for DailyFX.com
To contact Daniel, use the comments section below or @DanMcCathyFX on Twitter