

Japanese Yen, USD/JPY, US Dollar, CHF/JPY, Swiss Franc- Talking Points
- USD/JPY has pulled back from an historic high, but support levels are in view
- CHF/JPY appears to have set up for some range trading, will a break unfold?
- If the Yen weakening trend resumes, will USD/JPY take CHF/JPY higher?
Introduction to Technical Analysis
Learn Technical Analysis
Recommended by Daniel McCarthy
USD/JPY
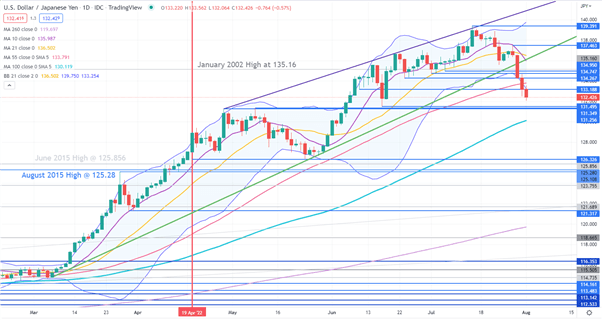
USD/JPY has pulled back from a 24-year high made last month and is around 5% below that peak of 139.39.
The move lower broke below an ascending trend line and progressed to pierce the lower band of the 21-day simple moving average (SMA) based Bollinger Band. When the price moved outside the upper Bollinger Band in July and then closed back inside the band, it marked the top in that bullish run.
For traders looking to buy this dip in USD/JPY, a close back inside the Bollinger Band might be something to watch for clues on the end of the bearish run. It should be noted though that past performance is not indicative of future results.
The price is below the 10-, 21- and 55-day SMAs but remains above the 100- and 260-day SMA. This might suggest that short and medium-term bearish momentum is unfolding while underlying long term support remains.
A move back above the 10-, 21- and 55-day SMAs may suggest a resumption of bullish momentum.
Support could be found at the previous low of 131.50, which is just above a couple of break points at 131.35 and 131.25.
On the topside, resistance might be offered at the break points of 134.27, 134.75 and 134.95 or at the prior highs of 137.46 and 139.39.

CHF/JPY
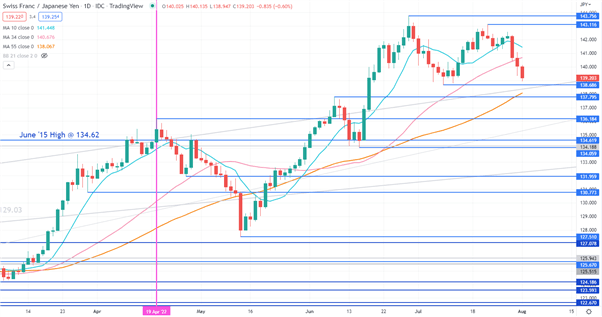
CHF/JPY has traded in a 138.68 – 143.75 range for six weeks and those levels may provide support and resistance respectively.
This is despite the Yen appreciating significantly against many other currencies in the last week.
It is nearing the bottom end of that range and if it moves lower, support could be at the break points of 137.80, 136.18 and 134.62 or at the mid-June low of 134.06. Above those levels, the 55-day simple moving averages (SMA) may provide support, currently at 138.07.
On the topside, resistance might be the 10- and 21-day SMAs currently at 141.45 and 140.68 respectively. The mid-July peak of 143.12 may also offer resistance.
Introduction to Technical Analysis
Candlestick Patterns
Recommended by Daniel McCarthy
--- Written by Daniel McCarthy, Strategist for DailyFX.com
To contact Daniel, use the comments section below or @DanMcCathyFX on Twitter