
EUR/GBP Technical Analysis
EUR/GBP – Bulls in Charge
Last week, EUR/GBP rallied to its highest level in nearly five months at 0.8744, then retreated as bulls seemed to cut back. Yet, the weekly candlestick closed in the green with 0.5% gain.
This week, the Relative Strength Index (RSI) has crossed above 70 then remained in overbought territory emphasizing the strength of uptrend momentum.
EUR/GBP Daily PRice CHART (Jun 1, 2018 – Mar 13, 2020) Zoomed Out
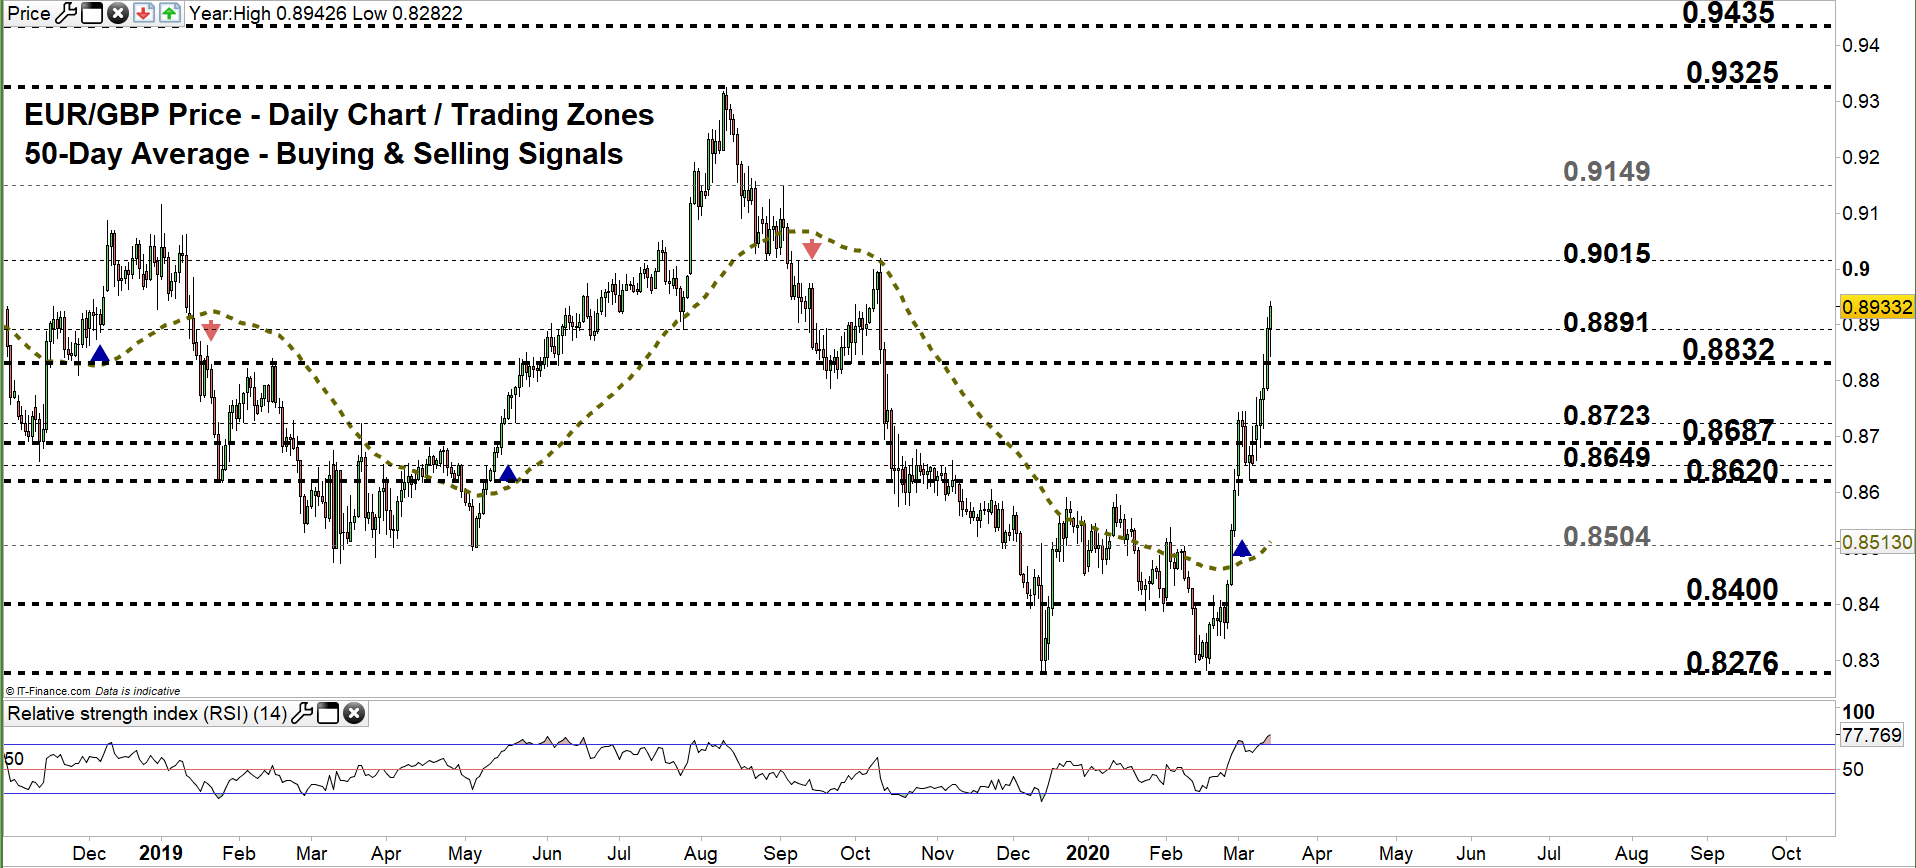

EUR/GBP DAILY PRICE CHART (NOv 15 – Mar 13, 2020) ZOOMED IN
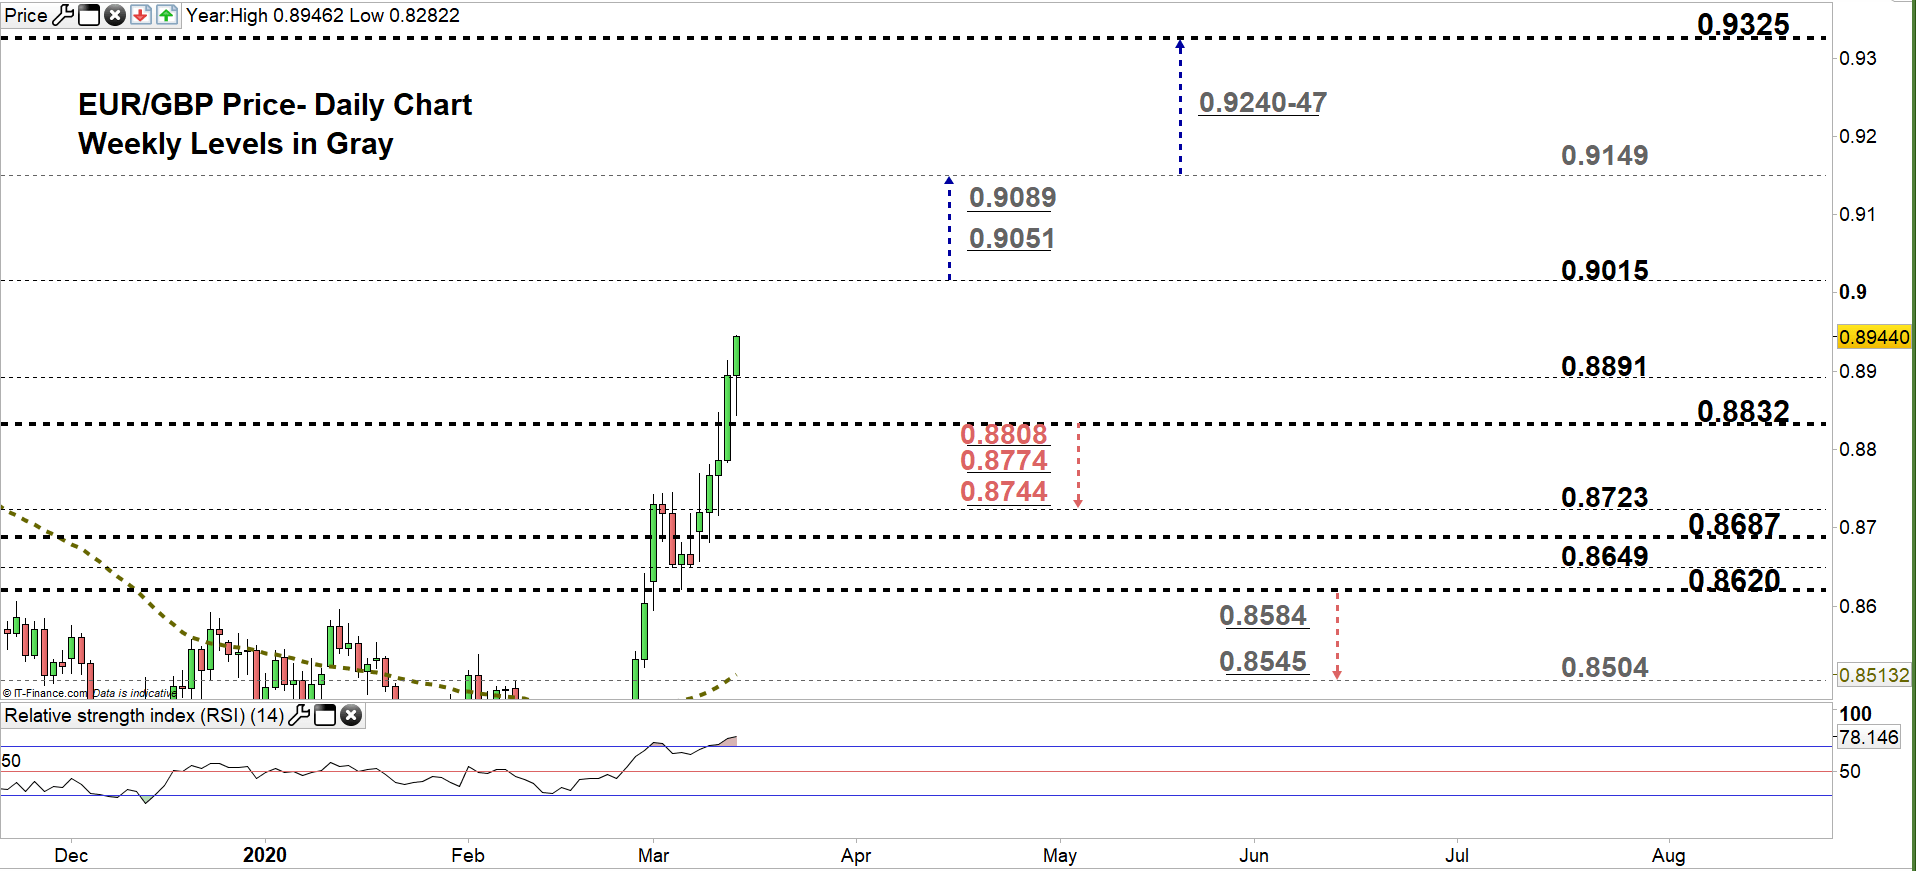
Looking at the daily chart, we noticed that on March 5 EUR/GBP rebounded from 0.8620 highlighting a possible bullish comeback. Since then, the price has taken off moving from a trading zone to the higher. Yesterday, the market moved to 0.8891 – 0.9015.
Hence, a close above the high end of the zone could mean more bullishness towards 0.9149. Further close above that level could encourage bulls to push towards 0.9325. In that scenario, the weekly resistance levels underscored on the chart (zoomed in) should be kept in focus.
On the other hand, any close below this level reflects bull’s hesitation. This could lead some of them to exit the market allowing the price to fall towards the low end of the zone. Further close below, 0.8832 could send EURGBP even lower towards 0.8723. That said, the daily support levels marked on the chart should be watched closely.

EUR/GBP FOUR HOUR PRICE CHART (Mar 2 - Mar 13, 2020)
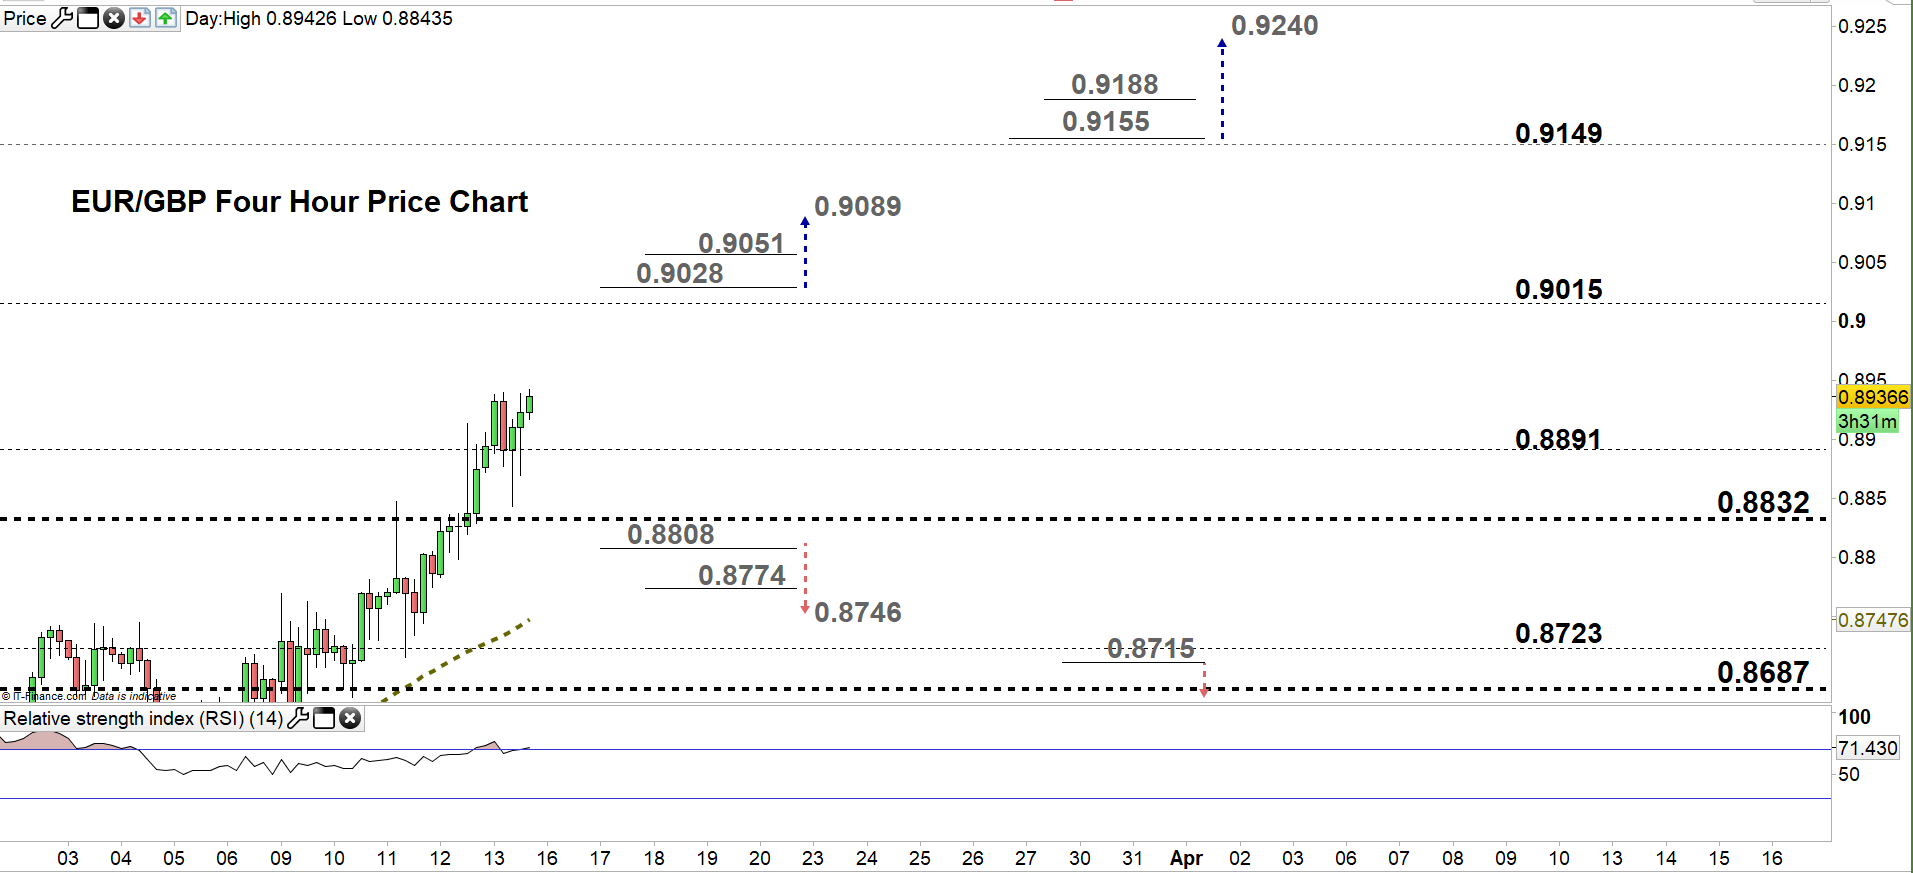
From the four- hour chart, we noticed that on Tuesday EUR/GBP resumed bullish price action creating higher highs with higher lows.
Thus, a break above 0.9028 may cause a further rally towards 0.9089. Although, the weekly resistance level underlined on the chart should be considered. On the other hand, a break below 0.8808 could send EURGBP towards 0.8746. Nevertheless, the daily support level printed on the chart would be worth monitoring.
See the chart to figure out more about key technical levels the price would encounter in a further bullish/ bearish scenario.

Written By: Mahmoud Alkudsi
Please feel free to contact me on Twitter: @Malkudsi