
EUR/USD Price Technical Analysis
- EUR/USD chart points out bearish signals
- Levels and thresholds to monitor
EUR/USD Price at Multi-Week Low
Last week, EUR/USD declined to 1.1019 -its lowest level in nearly eight weeks. On Friday, the weekly candlestick closed in the red for the fourth time in a row, with 0.6% loss.
Alongside that, the Relative Strength Index (RSI) fell from 45 to 37 reflecting stronger bearish momentum.
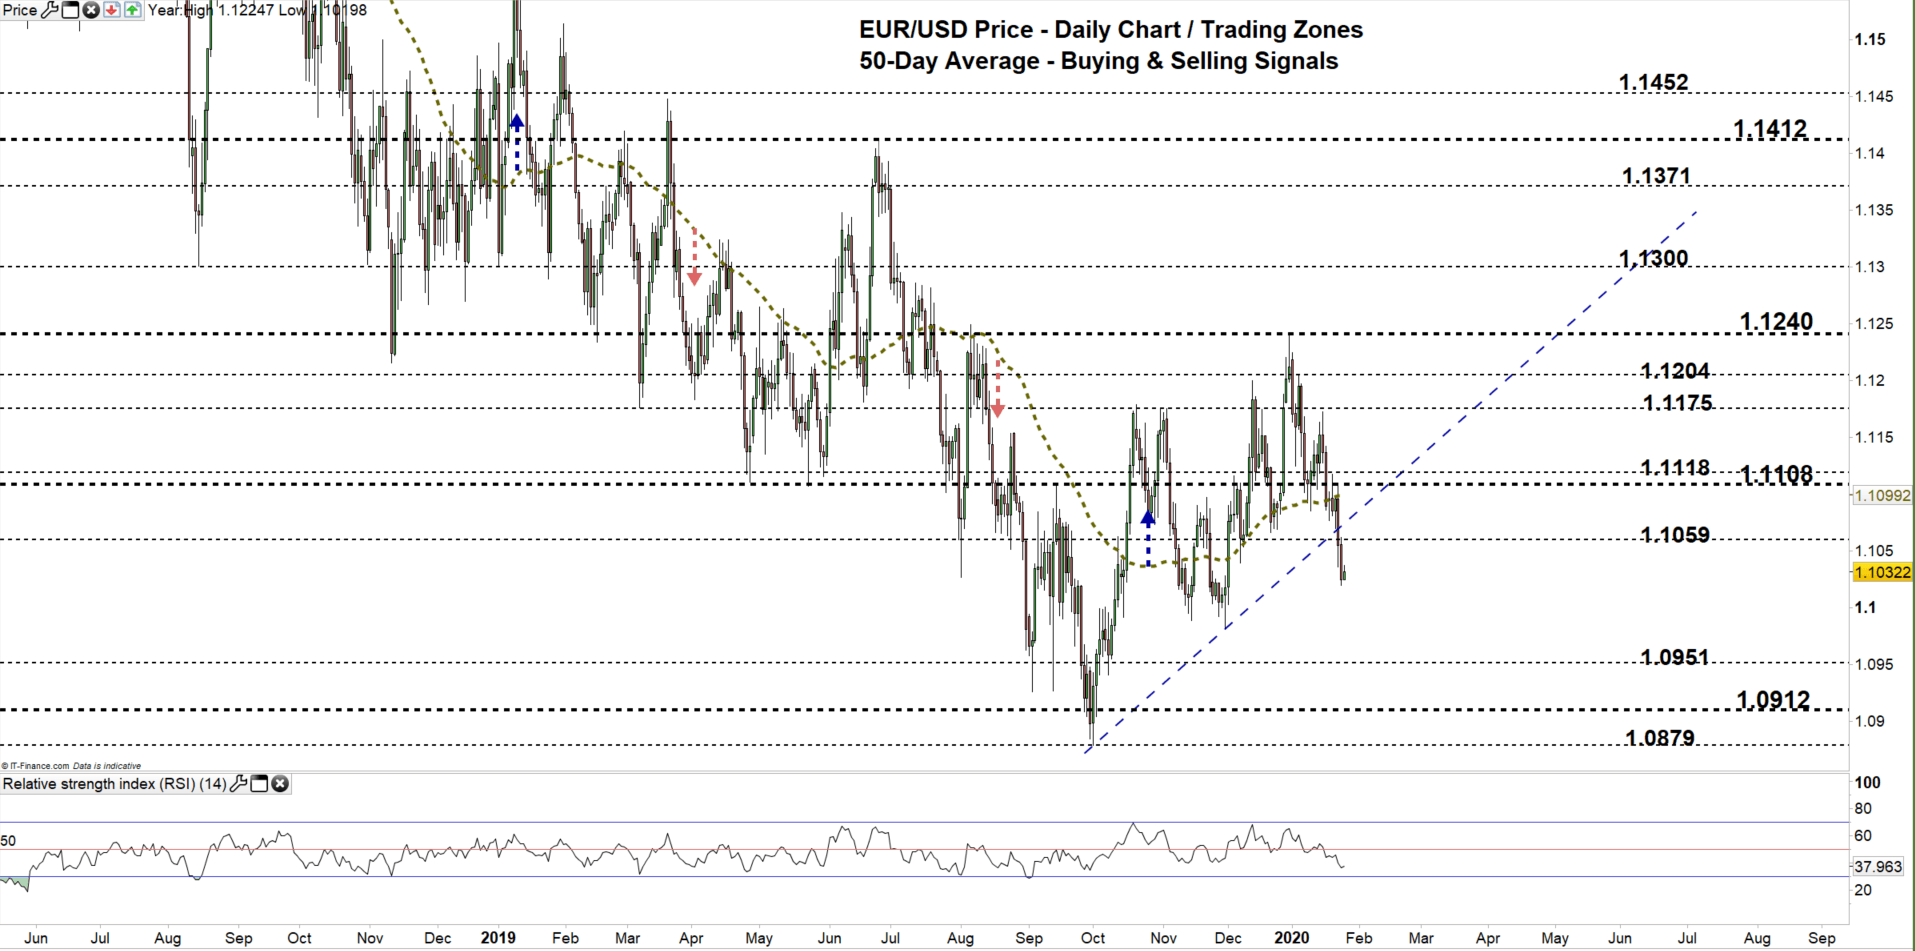
EUR/USD Daily PRice CHART (July 15, 2018 – Jan 27, 2020) Zoomed Out

EUR/USD Daily Price CHART (AUG 25 – Jan 27, 2020) Zoomed in
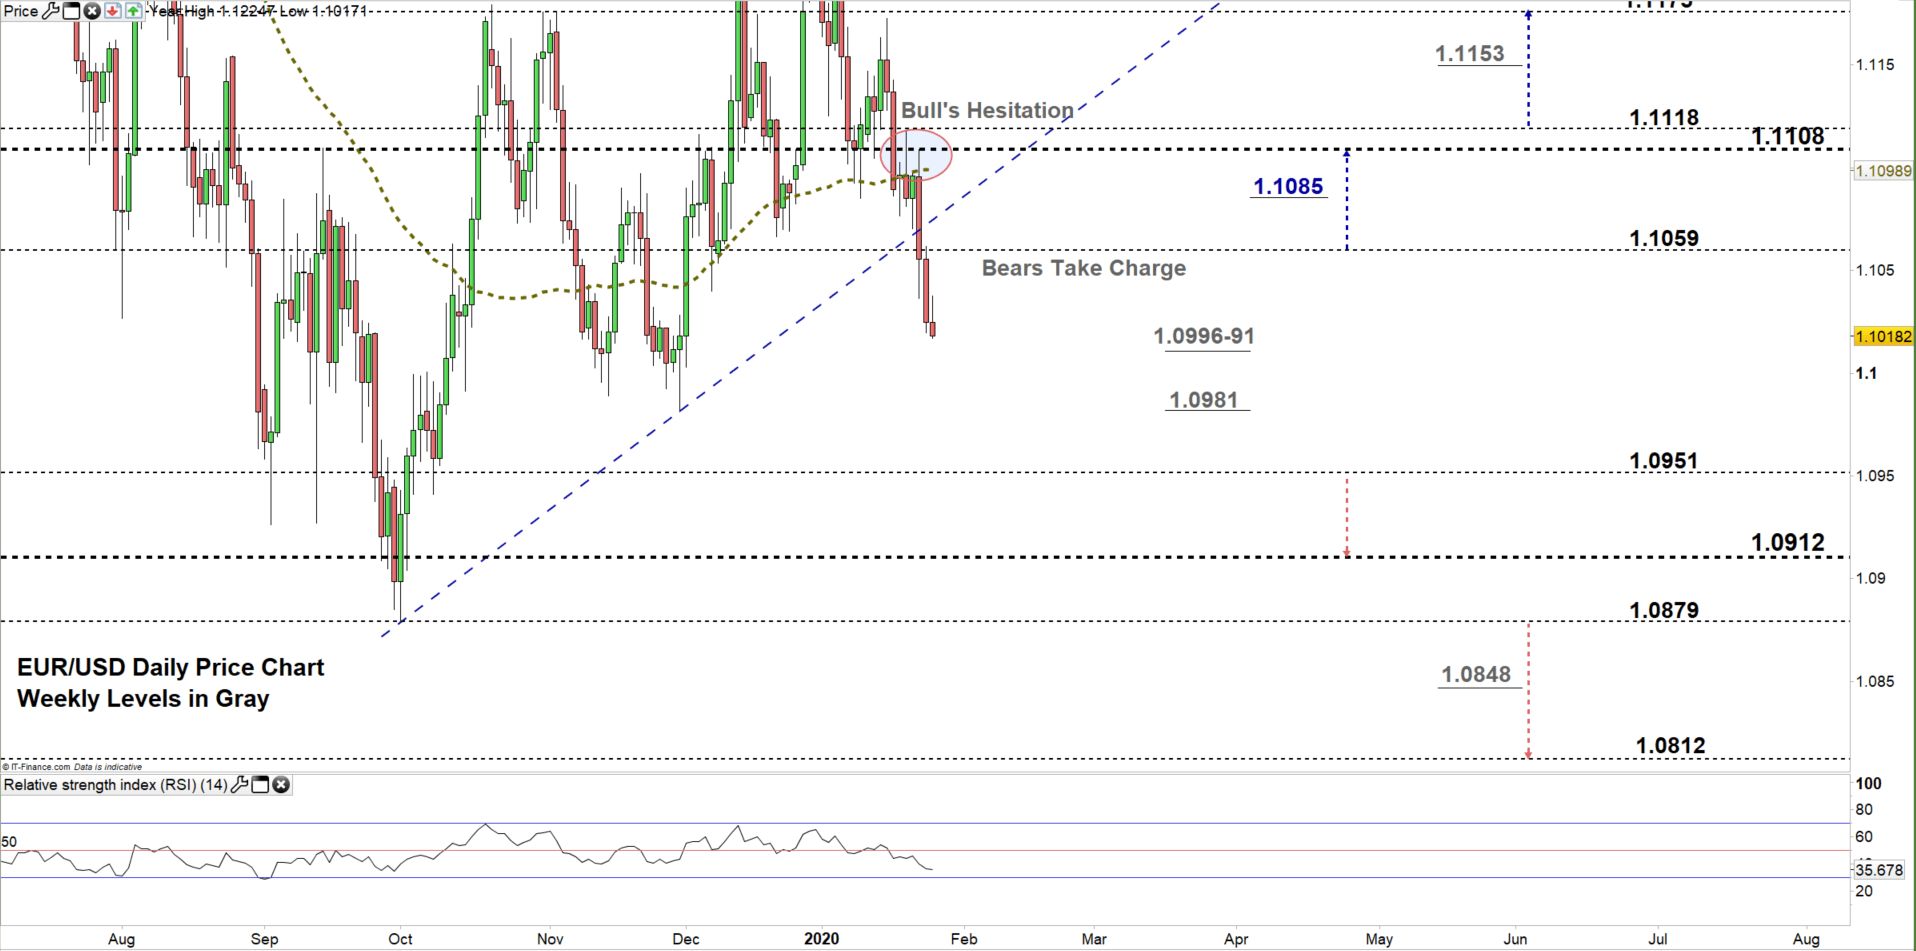
Looking at the daily chart, we notice on Jan 17 the price closed below the 50-day average and generated a bearish signal. Last week, the pair rebounded twice around 1.1108 highlighting bull’s hesitation. This led EUR/USD to break below the uptrend line originated from the Oct 1 low at 1.0879 , then plunge to a lower trading zone 1.0951- 1.1059 as discussed in our last update.
A close below the low end of the zone, could embolden EURUSD bears to press towards 1.0912. Further close below 1.0879 increases the likelihood for more bears to join the market towards 1.0812. Special attention should be paid to the weekly support levels/ trading zones marked on the chart (zoomed in) as some traders may join/exit the market around these points.
In turn, any close above the high end of the zone probably means shorts covering. This could reverse the market’s direction towards 1.1108. Although, the daily resistance level underscored on the chart should be considered.

EUR/USD four Hour Price CHART (Nov 21 – Jan 27, 2020)
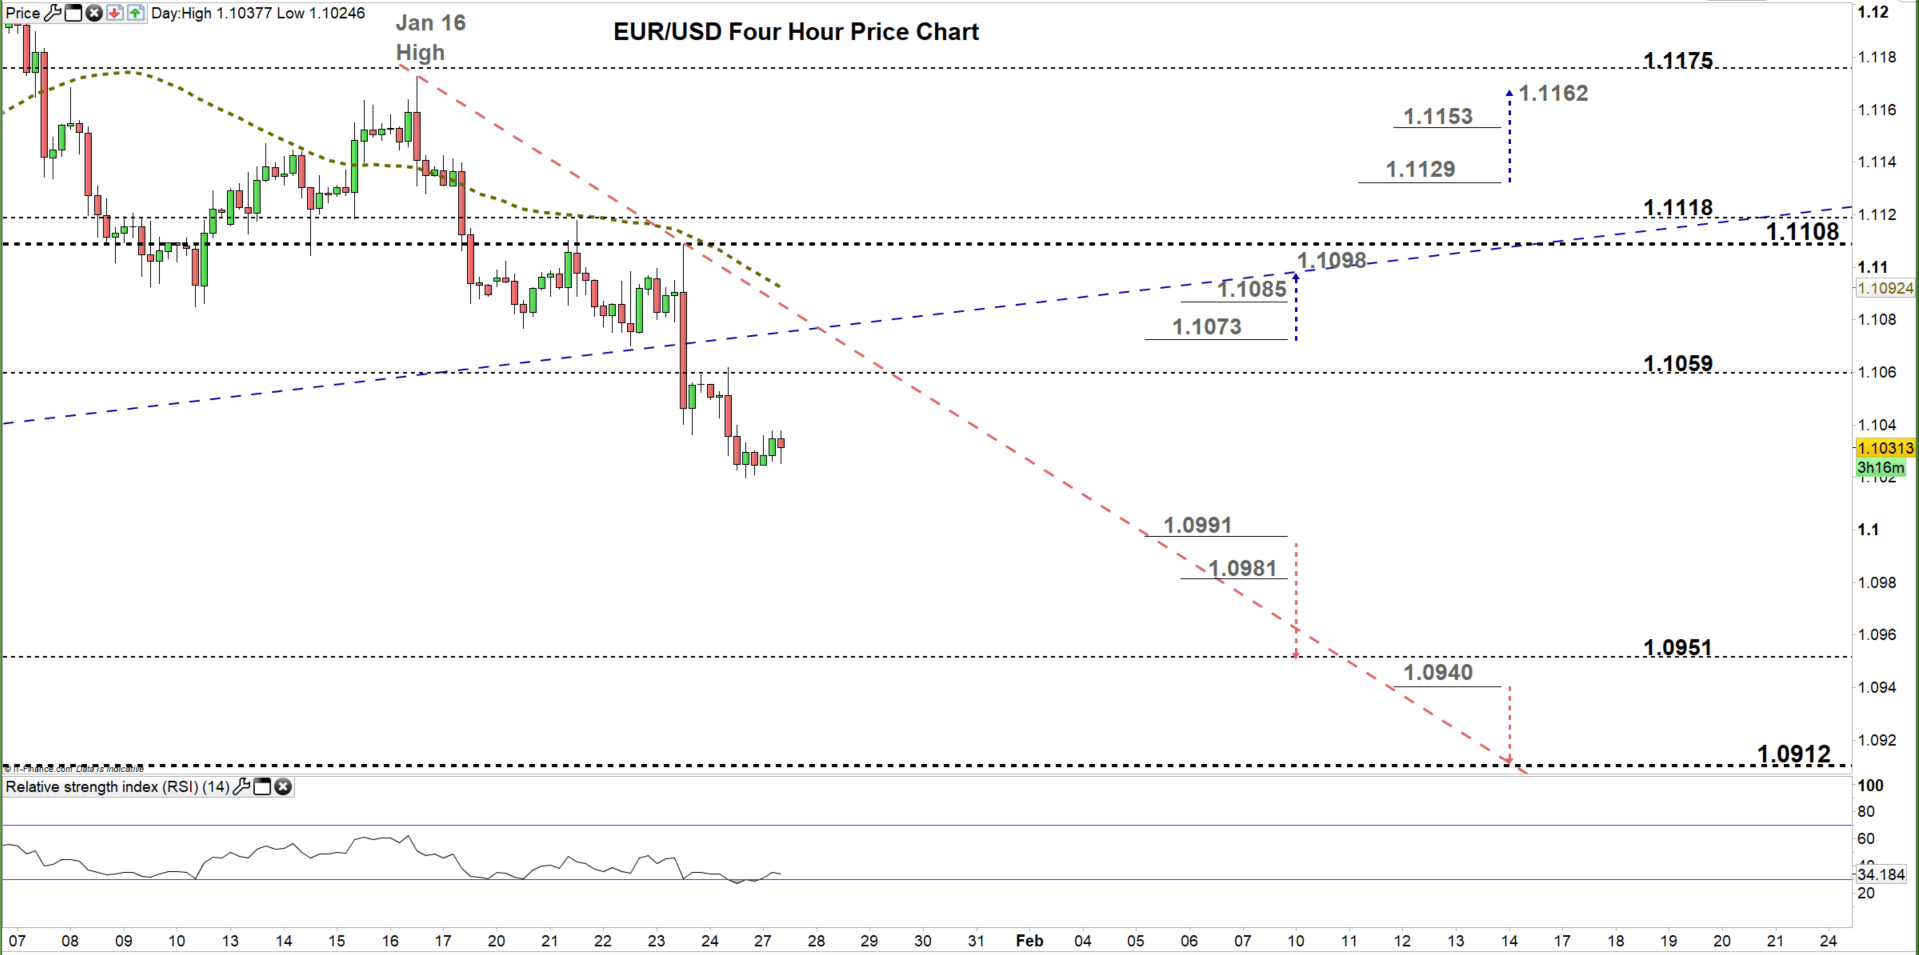
From the four-hour chart, we noticed on Jan 17 EUR/USD has started a downtrend move creating lower highs with lower lows. Any rally above the downtrend line originated from the Jan 16 high at 1.1172 would correct current downtrend move.
A break below 1.0991 could inspire EURUSD bears to lead the pair towards the low end of current trading zone discussed above on the daily chart. Yet, the weekly support level underlined on the chart should be kept in focus. On the other hand, a break above 1.1073 could cause a rally towards 1.1098. Nevertheless, the weekly resistance level marked on the chart would be worth monitoring.
See the chart to know more about key technical levels in a further bullish/bearish scenario.
Written By: Mahmoud Alkudsi
Please feel free to contact me on Twitter: @Malkudsi