


S&P 500 Technical Highlights
- SPX broke late-June trend-line yesterday
- Shifts focus towards big support from before
- Continue to watch the Nasdaq 100, FAANG
For the intermediate-term fundamental and technical outlook for S&P 500, check out the just-released Q4 Global Equities Forecast.
S&P 500 broke late-June trend-line yesterday
Yesterday, the S&P broke trend-line support rising up from the late-June low, but managed to trim losses to avoid its first down 1% day in over 70 days. We are currently in the third longest streak without a 1% loss since 2006. One of these days…
The late-day rebound made the break of trend support a little less meaningful, but if the market can’t quickly get its footing then look for a test of the prior swing lows near the high from January and April trend-line, situated in the vicinity of 2872/60.
This area marks an important spot to look for the market to hold or fold. A hold will keep things intact, while a break will bring into play again the all-important February 2016 trend-line/200-day MA combination. Things in the very near-term look like they could play out either way, making risk/reward from either side of the tape lack appeal.
For market sentiment and to learn more about how to use it in your analysis, check out the IG Client Sentiment page.
S&P 500 Daily Chart (T-line broke, 2872/60 could be next)

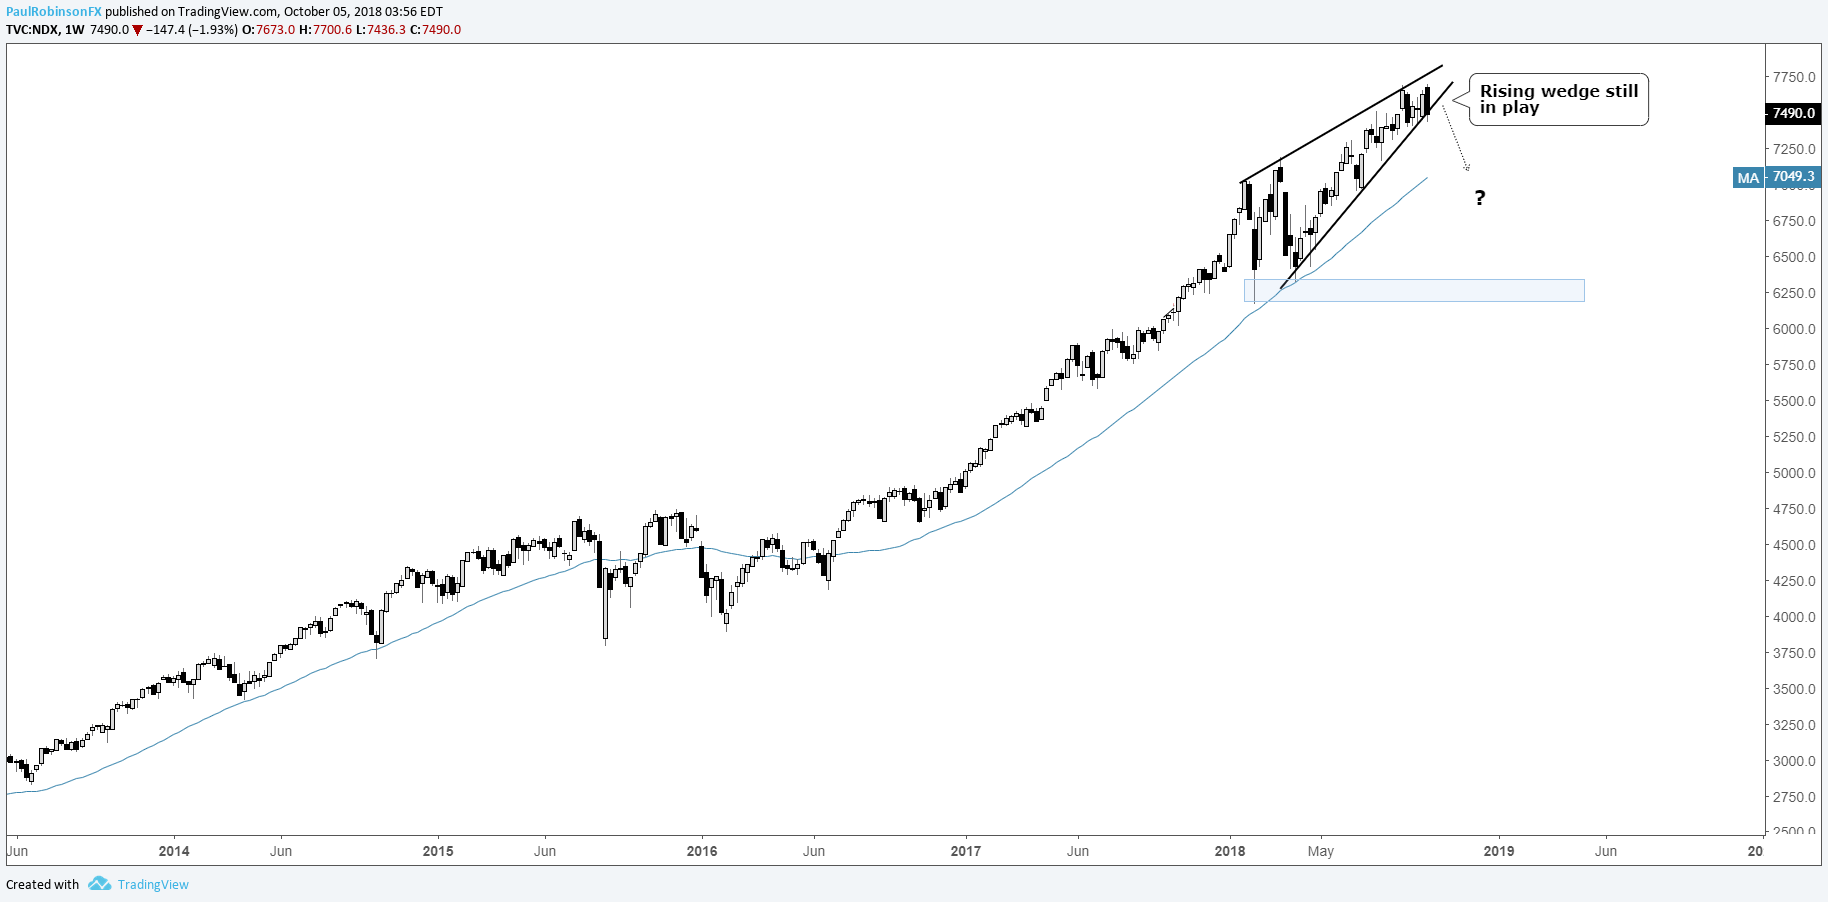
Continue to watch the Nasdaq 100, FAANG
Back in the early-part of September we looked at the Nasdaq 100 and market leaders ‘FAANG’, suggesting that how goes this group goes the market. Furthermore, there was and still is reason to be concerned that this group of leading stocks could be in for a bit of trouble.
The rising wedge we discussed in the NDX commentary from last month is still very much alive, and if triggered on the downside could mean not only will the NDX go lower, but be a bad omen for the entire stock market. If the pattern is broken with strong momentum, we’ll be looking for another swift decline to potentially develop.
Nasdaq 100 Weekly Chart (Rising Wedge)
Want to learn more about trading the S&P 500? Check out ‘How to Trade the S&P 500’, and join me weekly for technical updates in the Indices and Commodities webinar.
Forex & CFD Trader Resources
Whether you are a new or experienced trader, we have several resources available to help you; indicator for tracking trader sentiment, quarterly trading forecasts, analytical and educational webinars held daily, trading guides to help you improve trading performance, and one specifically for those who are new to forex.
---Written by Paul Robinson, Market Analyst
You can follow Paul on Twitter at @PaulRobinsonFX


