

Dow Jones Outlook:
- Home Depot (HD) accounts for the fifth largest share of the Dow Jones Industrial Average at nearly 5.5%
- Although the stock’s implied volatility is low, earnings could offer insight on the wider US economy and result in sector-specific or even broader Index volatility
- Sign up for our Free Weekly Equity Webinar in which critical technical levels and fundamental themes are analyzed each week
Dow Jones Forecast: HD Earnings Could Spark Stock Volatility
The Dow Jones journeyed higher on Monday as talks of stimulus in China and Germany helped to heal the outlook for global growth and equity markets. Evidently, the prospect of stimulus put a pause on recessionary concerns for the time being, but such concerns could rocket to the forefront of investor concern once more on Tuesday when Home Depot is slated to report earnings. If one of the Dow Jones’ largest components delivers results that paint an ominous view of the US economy or consumer appetite, other consumer discretionary stocks could feel pressure alongside Home Depot.
Dow Jones Stock Price Chart: Daily Time Frame (2017 – 2019) (Chart 1)
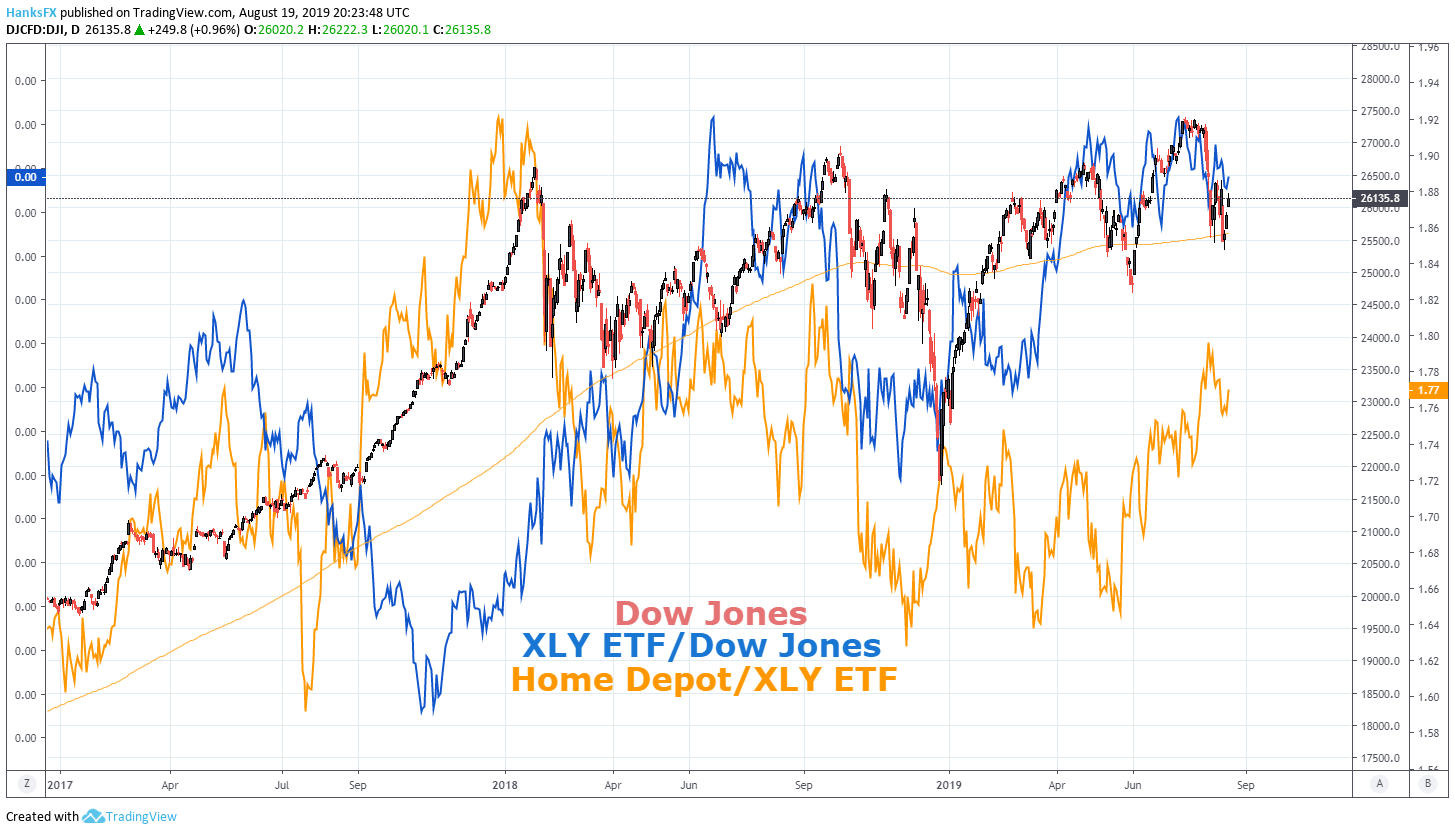
Chart created with TradingView. XLY = Consumer discretionary ETF
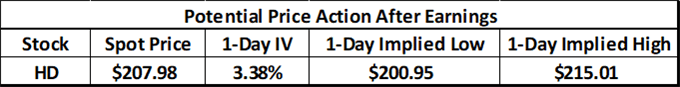
Although the stakes are high, Home Depot shares have an earnings-implied volatility of just 3.4%. Trading at roughly $208, the home-improvement store is relatively close to its all-time high of $219 – despite the growing uncertainty regarding the US economy and simultaneous deterioration in consumer confidence. To that end, if consumers harbor concern about the future of their earnings or the economy, they may be less willing to embark on household projects or purchase big-ticket appliances which would consequently eat away at Home Depot’s sales.
Without attempting to forecast direction, the implied price range includes a few notable technical levels. To begin, a modicum of resistance may be found near recent swing highs around $211.85. Subsequent barriers will look to exist at September 2018 highs around $215 and all-time highs at $219. On the other hand, support might take shape at the 78.6% Fibonacci level around $203 with possible influence from December’s ascending trendline slightly prior.
Home Depot (HD) Stock Price Chart: Daily Time Frame (June – August) (Chart 2)
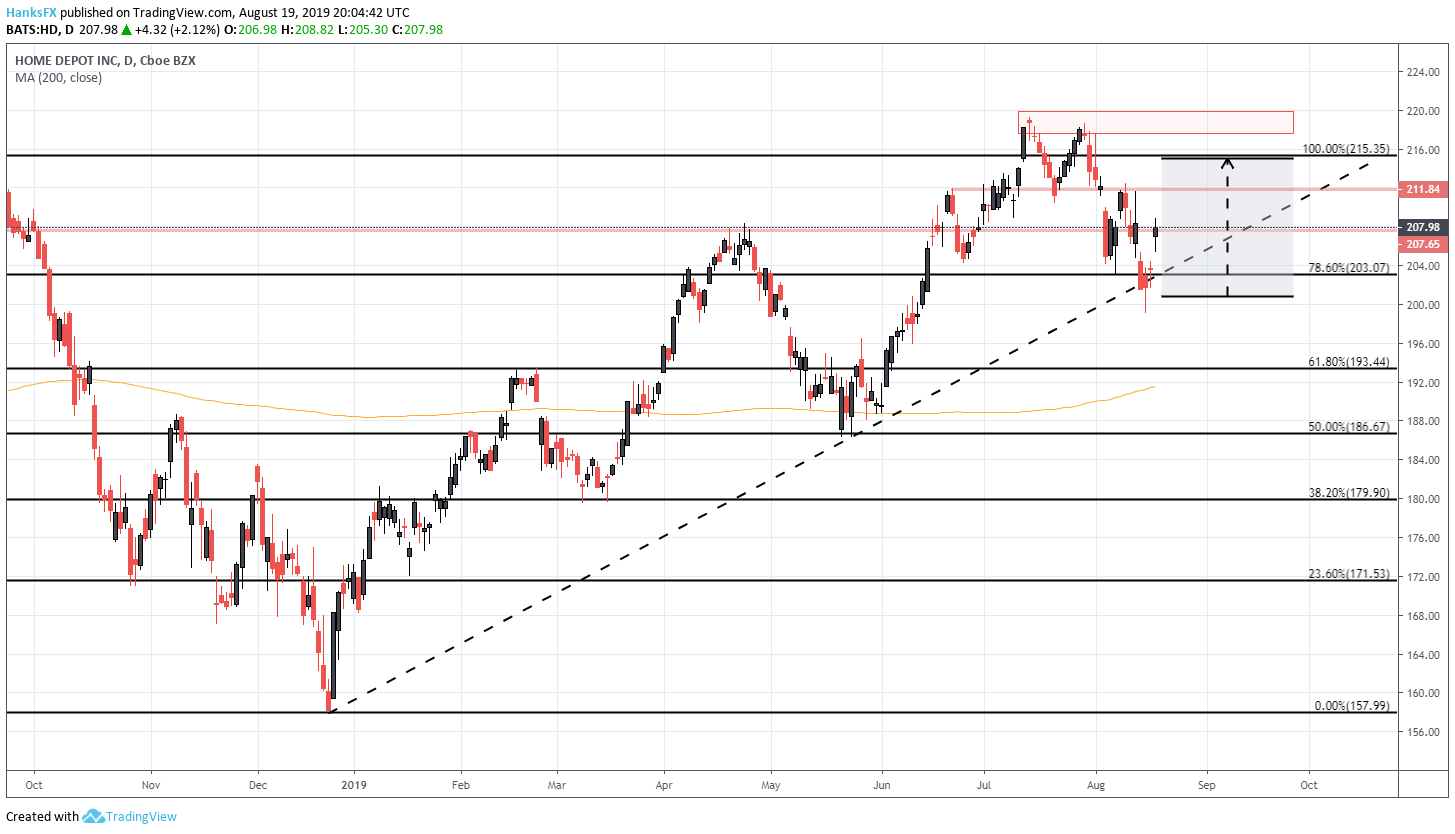
Chart created with TradingView
As for Home Depot’s potential impact on the Dow Jones, a strong earnings performance and subsequent rally in HD shares could help the Industrial Average gap above trendline resistance at the open. After posting a sizable gap higher on Monday, the DJIA closed narrowly beneath the ascending trendline from late December. If the Index can regain its footing above the line, it would be an encouraging sign for bulls – a gap above at the open would help to easily surpass the level.
Dow Jones Price Chart: 4 – Hour Time Frame (May – August) (Chart 3)
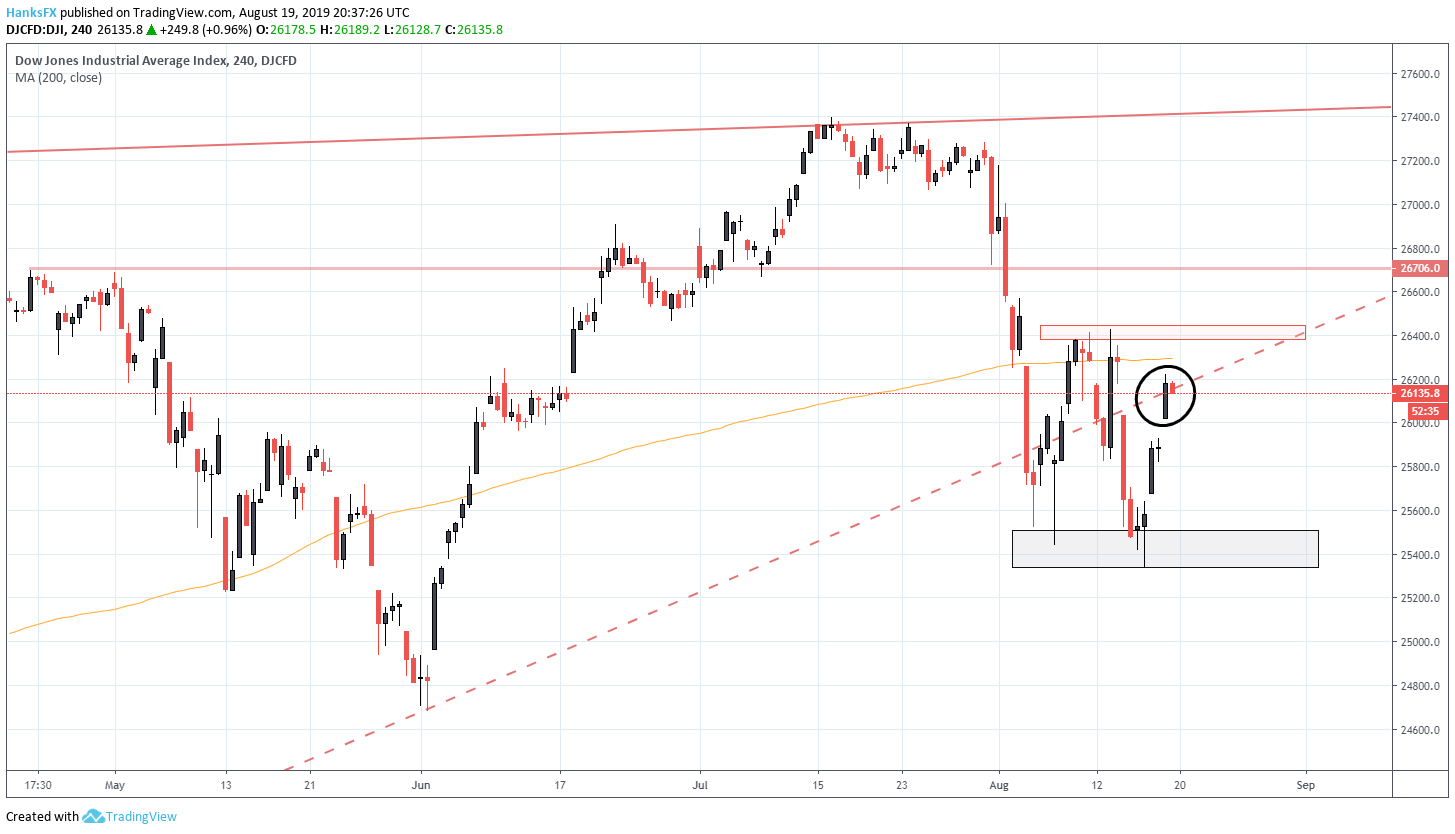
Chart created with TradingView
Should a bullish open occur, secondary resistance may materialize around 26,400 – marked by the swing highs earlier in August. Tertiary resistance might be offered around 26,700 where the Dow capped out in April and May. For more technical analysis and fundamental updates on the major equity markets, follow @PeterHanksFX on Twitter.
--Written by Peter Hanks, Junior Analyst for DailyFX.com
Contact and follow Peter on Twitter @PeterHanksFX
Read more: Dow Jones, DAX 30, FTSE 100, Nasdaq 100 Technical Forecasts