

Dow Jones, S&P 500 Highlights:
- Dow Jones tags 2015 high, may be low or very near
- S&P 500 lost 34% off the high, bounce sequence in play
Dow Jones tags 2015 high, may be low or very near
The freefall in markets was finally met with a meaningful rally, even if it has been only a day so far. The Dow Jones rallying 11% in a single day tops anything we saw during the 2008 crisis, and in fact you have to go back to the 1930s to find a single-day advance to match.
Does it mean the low is in? Perhaps, perhaps not. But it is a good place to start with the help of significant backing by the Fed, and soon to be joined by massive fiscal efforts. From a technical standpoint the current bounce has room to run given the size of the down-move just seen.
Should the rally start to extend from current levels, there are a couple of gaps on the upside to watch, starting with 21237, then followed by 23185 and 23553. There is a price level from the 2018 low at 21712 to watch as well. Once an initial bounce has run its course, a retest or a new low may be in store before prices can sustain for a longer period of time.

Dow Jones Daily Chart (2015 high as low so far)

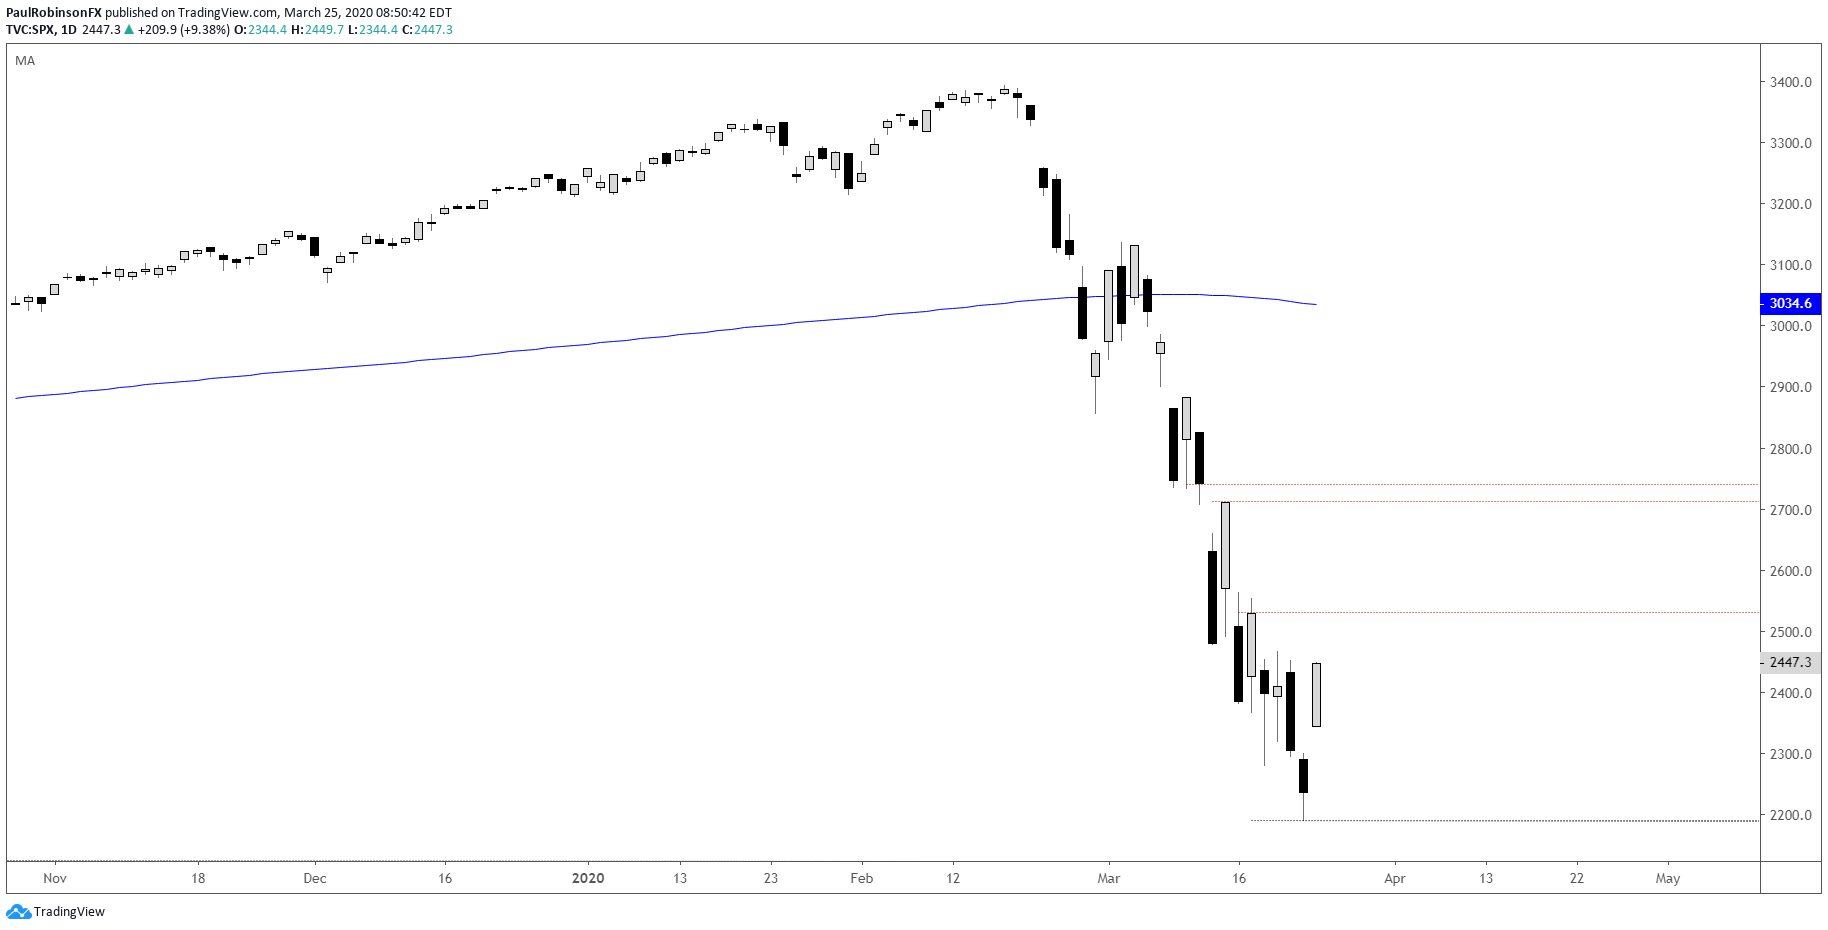
The S&P 500 is of course in the same boat as the Dow and the rest of the US indices. Support comes in by way of the 2191 low from Monday. The first gap to watch on the top-side is at 2529, followed by 2711 and 2741. The rally could go higher than the last level noted, but an initial bounce is likely to be put to the test even if the low only turns out to be an intermediate-term bottom.
S&P 500 Daily Chart (upside gaps to watch)
Resources for Forex Traders
Whether you are a new or experienced trader, we have several resources available to help you; indicator for tracking trader sentiment, quarterly trading forecasts, analytical and educational webinars held daily, trading guides to help you improve trading performance, and one specifically for those who are new to forex.
---Written by Paul Robinson, Market Analyst
You can follow Paul on Twitter at @PaulRobinsonFX